Customer Logins

Obtain the data you need to make the most informed decisions by accessing our extensive portfolio of information, analytics, and expertise. Sign in to the product or service center of your choice.

Customer Logins

My Logins

All Customer Logins

PointLogic

Learn more about PointLogic
A single interactive source for real-time market monitoring and short-term analysis for the North American natural gas markets

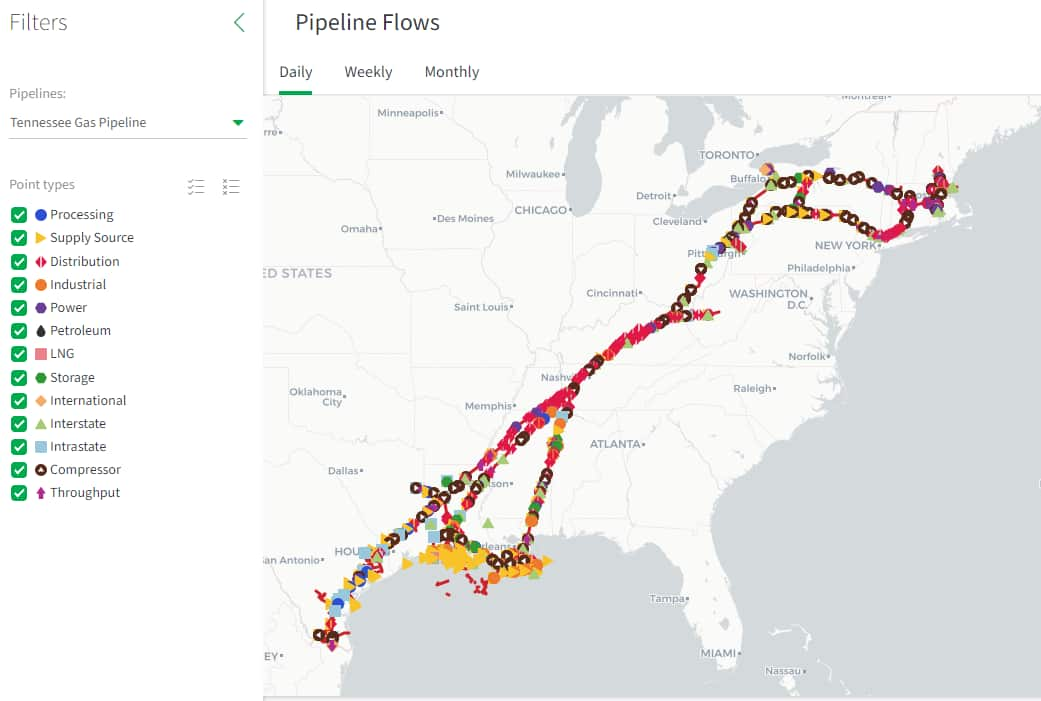
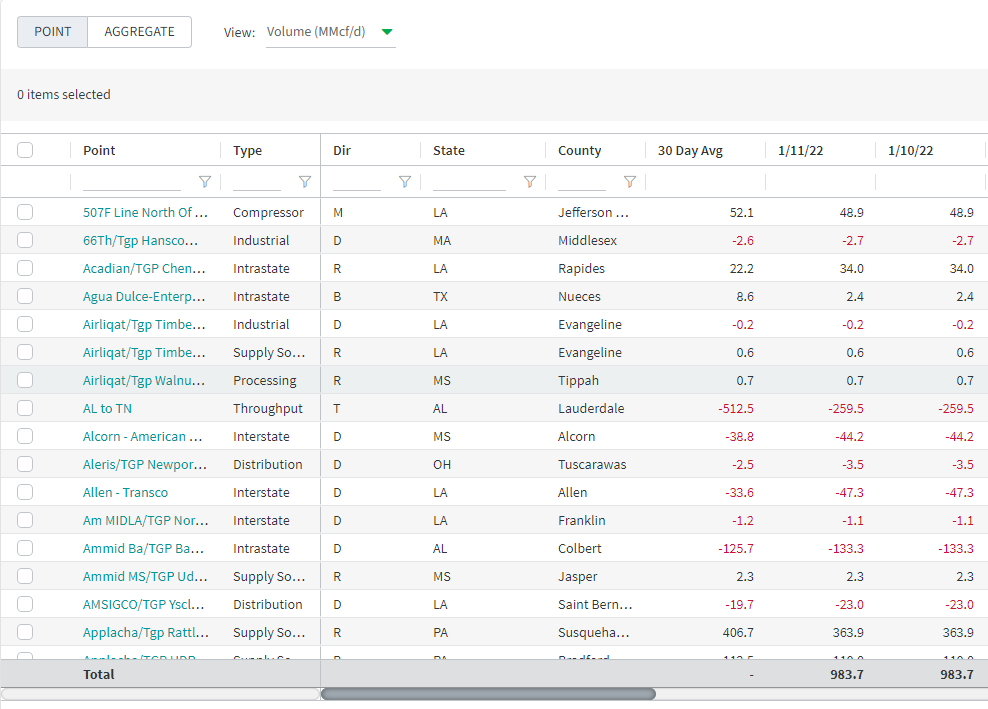
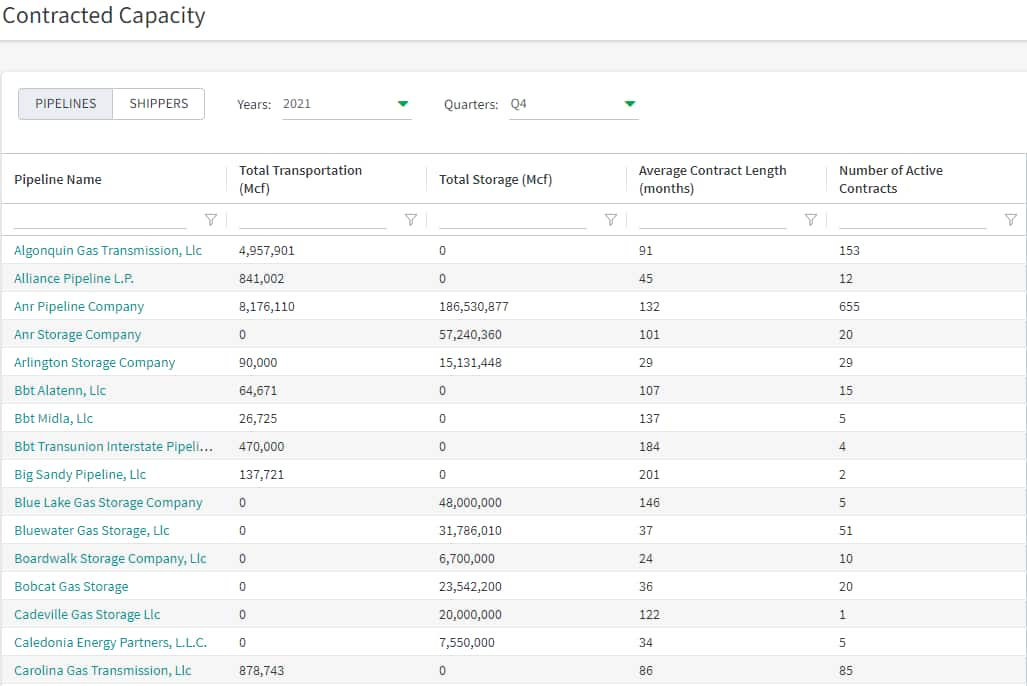
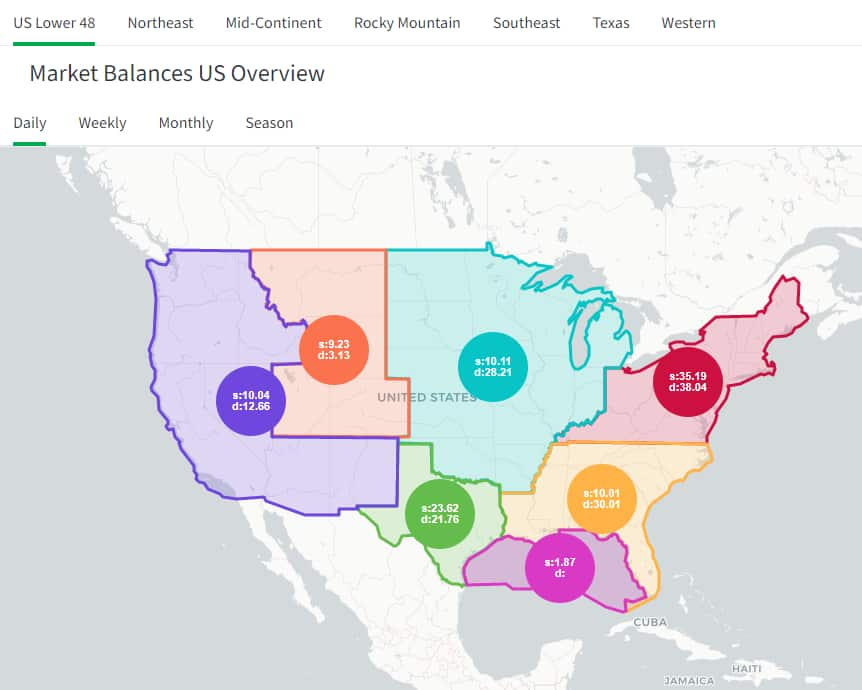
PointLogic provides up-to-the-minute expert analytics of the North American natural gas market. Our dynamic visual interface allows you to easily identify important natural gas trends and anomalies, as well as drill into the data to reveal the forces moving markets.

The service can monitor the market from several angles – whether it's live pipeline flow data and price formation in local markets or a macro view of daily supply and demand, the platform and service is built to alert you when market conditions change. A dozen sector and region-specific daily and weekly market reports are included, along with a custom Data Browser query tool that that allows you to create your own custom data reports.

PointLogic offers comprehensive natural gas data related to pipeline flows, production details, demand and supply analytics, regional reports, news and forecasts via a dynamic visual interface.

You can also build your own custom watchlists to monitor meter volumes, throughput volumes or volumes at storage, gas processing and power generation facilities. Each watchlist can be set up, based on user-defined percentage changes, to deliver natural gas data alerts daily, weekly or in real time.

Who can benefit from PointLogic?
  • Natural gas producers, buyers, and marketers
  • Natural gas pipeline and storage operators
  • Natural gas traders, brokers and market analysts
  • Energy company risk and planning departments
  • Utilities and power generators
  • Anyone else who needs immediate insight into the daily movements of natural gas markets
Request a Demo or Free Trial Learn how PointLogic can help you
REQUEST
Download Sample: Lower 48 Gas Fundamentals Daily Report Get a free sample of our daily, actionable market reports
DOWNLOAD REPORT


Short Term Forecasts

S&P Global North American Natural Gas Outlook

  • Subscribers to PointLogic also get the S&P Global North American Natural Gas Outlook, a three-year natural gas supply and demand forecast for Canada and the Lower 48 US states, which is updated each month. 
  • It includes an outlook for gas prices, degree days, and more.

Regional Profiles

  • As a companion to the outlook for North America, PointLogic provides regional profiles that offer balanced forecasts for selected regions in the US and Canada. 
  • They allow you to drill into evolving trends on a sub-regional level to see the expected relationships between regions and sub-regions. This insight is based on extensive research by S&P Global natural gas analysts.


Long Term Analysis

PointLogic provides comprehensive real-time market monitoring and short-term analysis for the North American natural gas markets—but what if you also need long-term analysis? The S&P Global Global Gas Service provides accurate forecasts and expert analysis out to 40 years. Together these two solutions provide a truly integrated and complete picture of the North American natural gas market. 

Learn more about S&P Global gas offerings.

Gas Flows & Operations

Pipeline flows


Supply & Demand Analytics

Drill into daily natural gas supply and demand fundamentals, price survey and Bidweek Prices and net storage inventories by facility. Follow import/export flows for hubs in the United States, Canada, and Mexico.

Functionality includes:

  • Interactive graphs to compare season-to-date and year-to-date
  • One-click access to charts showing what supply and demand locations are driving change each day
  • Spot/cash prices in wholesale markets for specific time periods and locations

Supply and demand balance

The Lower 48 US supply and demand balance is visualized on a map where you can drill into regional supply and demand data. Metrics include modeled dry and modeled wellhead, industrial, residential and commercial, power plants LNG pipe deliveries and exports, exports to Mexico, production losses and Canadian net imports.

Oil & Gas Production

See same-day natural gas production estimate at 112 producing areas by well type, plus monthly estimates of oil at the same areas. This includes all supply meter points in those areas and volume history by county and state, plus analysis of weekly rig counts.

PointLogic provides macro-to-micro production perspectives for wellhead and dry estimates on a unique dynamic interface with one-click charting for every producing area. Breakdowns by region and shale play are included with:

  • Complete supply data for natural gas and oil, including developments that are coming into the pipe from gathering versus processing
  • A complete picture of trends by geographic play using state historical data
  • Every active meter location and associated volume history
  • Monthly oil production by PADD in a single view

Processing and NGLs

PointLogic visualizes NGL trends and provides daily estimate of NGLs and ethane rejection and recovery by the 11 US Energy Information Administration (EIA) refining districts. It provides net throughputs at more than 280 gas processing plants along with data profiles of each plant.

News, Analysis, & Regional Reports

News and Analysis

The service includes PointLogic’s proprietary natural gas and power industry markets news coverage with regular analytics features, including weekly reports on gas demand, production, storage, NGLs and more. You can opt in to receive power or gas news daily or to be alerted when articles are about specific sectors or regions.

You can opt in to receive our flagship publication, Gas Fundamentals Daily, that provides expert market commentary and a snapshot of key gas market fundamentals data, including supply and demand balance, regional production, regional flows, prices and more.

Regional coverage

The PointLogic subscription includes:

  • Daily market fundamentals reports for the Lower 48, Canada, and Mexico that includes market commentary
  • Daily regional fundamentals reports that drill into daily supply, demand, flow, and price trends
  • Weekly regional reports that provide market commentary with a macro-data perspective of regional fundamentals

You can opt to receive any of the regional fundamentals dailies for the Northeast, Texas & Southeast, Mid-Continent, Rocky Mountain/Western, Canada, and Mexico. You can also choose by topic and region what natural gas news and analysis you want to receive via alerts.

How do clients use PointLogic?

A Natural Gas Trader

Assesses natural gas supply and demand trends within a region or on a specific pipeline to determine the target price point to buy or sell gas

A Gas-fired Power Plant Operator

Monitors utilization on pipelines to determine potential routes around a bottleneck on its primary delivery pipeline

A Natural Gas Producer

Monitors natural gas pipeline flows and market area demand to identify the best netback price

A Natural Gas Risk Manager

Monitors regional supply, demand and gas flow trends to assess peak demand times and potential risks that could limit gas availability

How PointLogic can help you


US natural gas infrastructure inflection point (2:57)


Watch a video demonstration of our tool by one of our experts. (2:36)


Get an overview of our new coverage on Mexico Featuring a case study demonstration (starting at 1:39)

PointLogic Spotlight
View More
Blog Sep 07, 2024

Indonesia's block awards drive exploration across mature, emerging, and frontier areas

Blog Sep 06, 2024

Fueling growth: Indonesia's block awards drive exploration across mature, emerging, and frontier areas

Blog Sep 06, 2024

Not in my backyard… or yours: What the new EU Methane Rule means for Kazakh crude oil exports

Blog Sep 04, 2024

GHG intensity of offshore Nigeria production in 2023

You may be interested in

Industries

Climate and Sustainability Image

Global Gas Supply, Demand and Pricing Outlooks

Climate and Sustainability Image

PointLogic Short-term Natural Gas Analysis

Maritime & Trade Image

Bill of Lading Database, Import Export Data: PIERS

Maritime & Trade Image

Base de datos de conocimiento de embarque

Chemical Image

Methyl Methacrylate - Process Economics Program (PEP)

Maritime & Trade Image

Dry Bulk Freight Rate Forecast

Oil & Gas Upstream Image

Natural Gas Liquid (NGL) Market Analysis and Forecasting

Financial Services Image

Enterprise Data Management (EDM) - Data Management Solutions for the Energy Industry| S&P Global

Oil & Gas Upstream Image

Midstream Infrastructure and Markets Database

Chemical Image

Acetic Acid - Chemical Economics Handbook (CEH)

Chemical Image

Acetaldehyde - Chemical Economics Handbook (CEH)

Chemical Image

Acetone - Chemical Economics Handbook (CEH)

Chemical Image

Acetonitrile - Chemical Economics Handbook (CEH)

Chemical Image

Acetic Anhydride - Chemical Economics Handbook (CEH)

Chemical Image

Acetylene - Chemical Economics Handbook (CEH)

Chemical Image

Acrylamide - Chemical Economics Handbook (CEH)

Chemical Image

Acrylic Acid, Acrylate Esters and Polymers - Chemical Economics Handbook (CEH)

Chemical Image

Acrylic and Modacrylic Fibers - Chemical Economics Handbook (CEH)

Explore

  • Climate and Sustainability
  • Climate and Sustainability
  • Oil & Gas Upstream
  • Bid Rounds
  • Commodity Trading
  • Financial Trading
  • Market Analysis & Forecasts
  • Natural Gas / LNG Markets
  • Trade Data
{"items" : [ {"name":"facts","url":"","enabled":false,"desc":"","alt":"","mobdesc":"PDF","mobmsg":""},{"name":"login","url":"https://connect.ihsmarkit.com/gpe/PointLogic/dashboard/overview","enabled":true,"desc":"Product Login for existing customers","alt":"Login","large":true,"mobdesc":"Login","mobmsg":"Product Login for existing customers"},{"name":"sales","override":"","number":"[num]","enabled":true,"desc":"Call Sales [num]","proddesc":"[num]","alt":"Call Sales</br>[num]","mobdesc":"Sales","mobmsg":"Call Sales: [num]"}, {"name":"share","enabled":true,"desc":"<strong>Share</strong>","mobdesc":"Share","options":[ {"name":"facebook","url":"https://www.facebook.com/sharer.php?u=http%3a%2f%2fssl.ihsmarkit.com%2fcommodityinsights%2fen%2fci%2fproducts%2fpointlogic-gas.html","enabled":true},{"name":"twitter","url":"https://twitter.com/intent/tweet?url=http%3a%2f%2fssl.ihsmarkit.com%2fcommodityinsights%2fen%2fci%2fproducts%2fpointlogic-gas.html&text=PointLogic+Short-term+Natural+Gas+Analysis+%7c+S%26P+Global","enabled":true},{"name":"linkedin","url":"https://www.linkedin.com/sharing/share-offsite/?url=http%3a%2f%2fssl.ihsmarkit.com%2fcommodityinsights%2fen%2fci%2fproducts%2fpointlogic-gas.html","enabled":true},{"name":"email","url":"?subject=PointLogic Short-term Natural Gas Analysis | S&P Global&body=http%3a%2f%2fssl.ihsmarkit.com%2fcommodityinsights%2fen%2fci%2fproducts%2fpointlogic-gas.html","enabled":true},{"name":"whatsapp","url":"https://api.whatsapp.com/send?text=PointLogic+Short-term+Natural+Gas+Analysis+%7c+S%26P+Global http%3a%2f%2fssl.ihsmarkit.com%2fcommodityinsights%2fen%2fci%2fproducts%2fpointlogic-gas.html","enabled":true}]}, {"name":"rtt","enabled":true,"mobdesc":"Top"} ]}
Filter Sort