Customer Logins
Obtain the data you need to make the most informed decisions by accessing our extensive portfolio of information, analytics, and expertise. Sign in to the product or service center of your choice.
Customer Logins
BLOG
Jan 26, 2021
How much did the winners in the US-China trade war win?
A recent blog post considered the success (or not) of US section 301 tariffs imposed on mainland China. Southeast Asian economies emerged as beneficiaries of the resulting trade diversion. Here we consider how significant the impact was for them.
GDP boost?
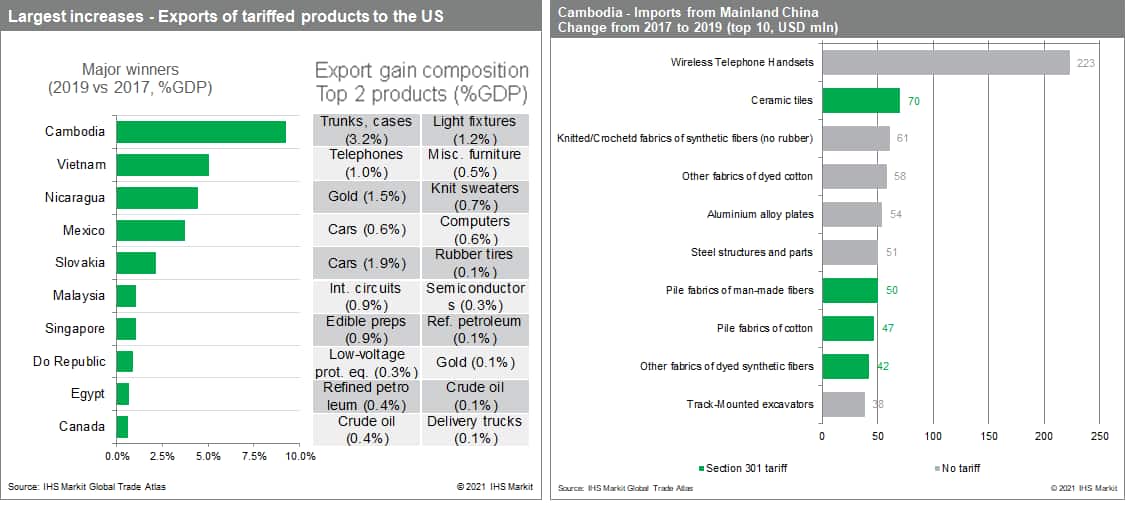
Chart 1 ranks countries by the change in their exports to the US as a percentage of their GDP between 2017 and 2019 - counting only exports tariffed under section 301. For Cambodia, Vietnam and Mexico the gains ranged between 4% and 9%, and are concentrated in a handful of industries: trunks/ cases accounted for 3.2 percentage points in Cambodia; telephones 1 percentage point in Vietnam; and cars 0.6 percentage point in Mexico.
Cambodia: A cautionary tale
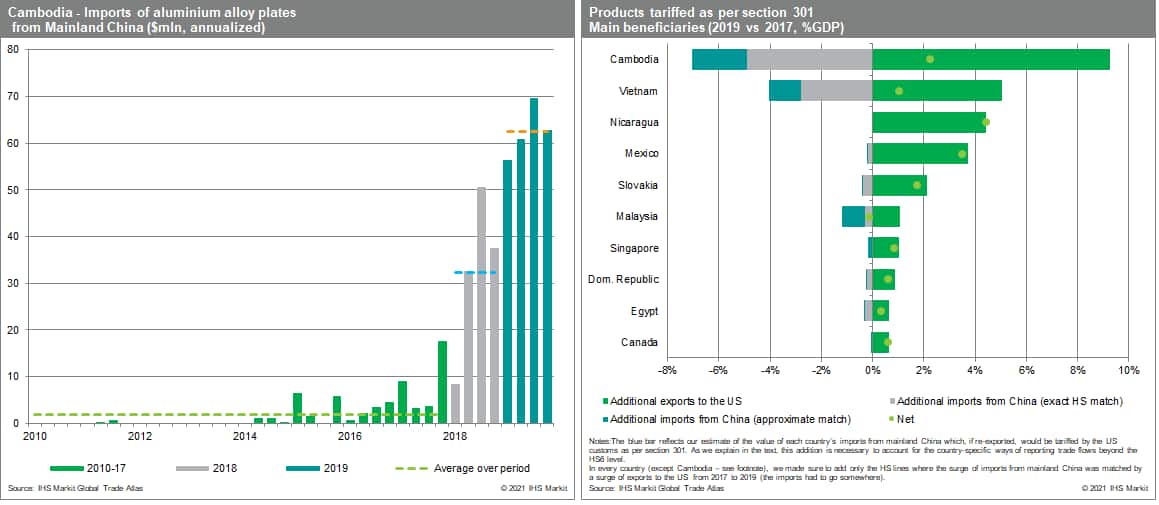
Read these figures cautiously. Numerous reports (for example, here and here) suggest that the gain for Cambodia, for example, is the result of Chinese companies rerouting exports via Cambodia to evade tariffs. Other data corroborate these reports. Cambodian GDP growth did not accelerate by 9pp over 2018-19; four of the ten largest import increases by Cambodia from mainland China from 2017 to 2019 appear in the section 301 list of tariffs published by the US administration (see chart 2); and the surge of Cambodian section 301 exports coincided with a surge in Cambodian imports from China - of the same goods - of about 5% of GDP (Chart 4). Moreover, this 5% figure is likely an underestimate as trade data reported by each country is rarely consistent at the granular level at which the section 301 tariffs are listed.
Take the instance of aluminum plates, which appears among the ten Cambodian imports from mainland China having seen the most significant increases - USD 54mln - since the tariff war started. While this flow was reported by mainland China under HS 760612.20, the same good very likely should be recorded as an import of HS 760612.30, or 760612.90 when it reaches the US, which are both tariffed (760612.20 is a line specific to mainland China and never appeared in U.S. imports from any country). The timing is also a good indication: virtually non-existent from 2010 to 2017, Cambodian imports of such products suddenly jumped over the course of 2018, and doubled in 2019 (Chart 4).
The same pattern can be discerned for a number of other products. Accounting for these, in aggregate, reduces the Cambodian gain from 9% of GDP to 2% (see chart 3). (IHS Markit could not trace some all such exports/ re-exports since they do not all appear in US - or any other countries' - imports data. Nonetheless, their size - USD220 million of additional cordless telephone imports in 2019 compared to 2017 or 1% of Cambodian GDP indicates did not remain in Cambodia. Also, the timing of the increase and their proximity to products listed under section 301 clearly link them to the tariffs.) Running the same exercise for the countries of chart 1, we made similar adjustments for Vietnam (5% of GDP to 1%) and Malaysia (1% to no net gain) - but smaller adjustments for Mexico and Slovakia. (Nicaragua's GDP gains over the period came mostly from the rise of gold prices.)
In all, the net boost from the redirection of trade flows at the global level was worth a few points of GDP for the most fortunate countries. Put in the context of the global economy slowing throughout 2019, in part because of the tariff war, these gains were appreciable. Moreover, especially in the case of Vietnam, they had the effect of consolidating a US ally's position in strategically important sectors (telecoms), in which it already enjoyed control of the downstream production chain.
{"items" : [
{"name":"share","enabled":true,"desc":"<strong>Share</strong>","mobdesc":"Share","options":[ {"name":"facebook","url":"https://www.facebook.com/sharer.php?u=http%3a%2f%2fssl.ihsmarkit.com%2fmarketintelligence%2fen%2fmi%2fresearch-analysis%2fhow-much-did-the-winners-in-the-uschina-trade-war-win.html","enabled":true},{"name":"twitter","url":"https://twitter.com/intent/tweet?url=http%3a%2f%2fssl.ihsmarkit.com%2fmarketintelligence%2fen%2fmi%2fresearch-analysis%2fhow-much-did-the-winners-in-the-uschina-trade-war-win.html&text=How+much+did+the+winners+in+the+US-China+trade+war+win%3f+%7c+S%26P+Global+","enabled":true},{"name":"linkedin","url":"https://www.linkedin.com/sharing/share-offsite/?url=http%3a%2f%2fssl.ihsmarkit.com%2fmarketintelligence%2fen%2fmi%2fresearch-analysis%2fhow-much-did-the-winners-in-the-uschina-trade-war-win.html","enabled":true},{"name":"email","url":"?subject=How much did the winners in the US-China trade war win? | S&P Global &body=http%3a%2f%2fssl.ihsmarkit.com%2fmarketintelligence%2fen%2fmi%2fresearch-analysis%2fhow-much-did-the-winners-in-the-uschina-trade-war-win.html","enabled":true},{"name":"whatsapp","url":"https://api.whatsapp.com/send?text=How+much+did+the+winners+in+the+US-China+trade+war+win%3f+%7c+S%26P+Global+ http%3a%2f%2fssl.ihsmarkit.com%2fmarketintelligence%2fen%2fmi%2fresearch-analysis%2fhow-much-did-the-winners-in-the-uschina-trade-war-win.html","enabled":true}]}, {"name":"rtt","enabled":true,"mobdesc":"Top"}
]}