Customer Logins
Obtain the data you need to make the most informed decisions by accessing our extensive portfolio of information, analytics, and expertise. Sign in to the product or service center of your choice.
Customer Logins
ECONOMICS COMMENTARY
Aug 05, 2020
Global producer prices show largest rise for over a year as demand revives

- Global manufacturing PMI data show input prices rising at the steepest rate since April 2019
- Price pressures have risen as demand has revived following the pandemic, but supply chain delays persist, adding an extra boost to pricing power
- Currency movements are also playing a key role in determining national price variations
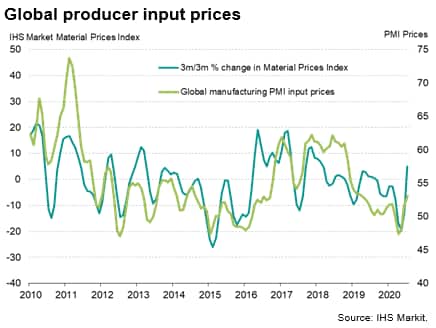
Producer input prices rose globally at the fastest rate for over a year in July amid rising demand as the world's factories bought more inputs to support growing production needs, according to purchasing managers.
A key gauge of global manufacturing output from IHS Markit's PMI surveys hit a one-and-a-half year high in July, with the return to growth accompanied by the sharpest rise in input prices since April 2019.
The increase in raw material prices signalled by the PMI survey accompanied a similar message from IHS Markit's Materials Price Index, which tracks prices for a basket of commodities. This index has risen in US dollar terms so far in July to its highest since January, with prices up by around 30% on average from the lows seen in mid-April.
Tracking prices pressures
To see why prices have risen we can look at some of the JPMorgan Global Manufacturing PMI survey sub-indices. These data, compiled by IHS Markit, allow the analysis of how supply and demand fundamentals - or even speculative forces - are affecting prices.
From a demand perspective, the PMI surveys track the amount of goods purchased by manufacturers and orders for intermediate goods (i.e. inputs ordered by other companies), though we also find that the survey's output gauge acts as a very good proxy for raw material demand, especially given the widespread adoption of just-in-time production practices at manufacturers.
From a supply perspective, we use the PMI suppliers' delivery times index to assess the degree to which supply chains are stretched and the resulting impact on prices.
Generally speaking, rising demand and supply chain delays exert upward pressure on prices, but when demand falls and supply times become quicker, prices tend to fall. The former is often characterised by a sellers' market (demand exceeds supply) whereas the latter is more commonly seen as a buyers' market (supply exceeds demand).
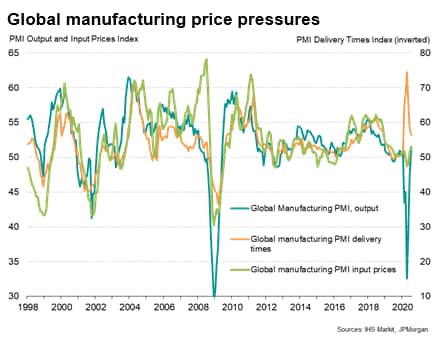
In our chart, the suppliers' delivery times index has been inverted such that the higher the index on this scale, the greater the incidence of supply chain delays. As the chart illustrates, these delays are usually a symptom of demand rising as production growth accelerates. More demand means suppliers get stretched and cannot supply enough inputs without incurring delays. In such times, manufacturers are often willing to pay a premium for the timely supply of inputs. Such instances were especially evident in 1999-2000 and 2004.
Conversely, in periods such as 2001 and the global financial crisis of 2008-9, demand slumped as production fell, meaning suppliers were often left holding large quantities of unsold stock (the existence of which meant deliveries could be made very promptly). Discounts were therefore commonly offer to sell such excess inventories, driving prices lower.
Sometimes, the behaviour of the indices suggests factors other than supply and demand are operating. For example, the spike in prices prior to the global financial crisis in 2007 was accompanied neither by surging demand nor supply constraints. Hence we argued at the time that higher prices were primarily a symptom of speculation, and therefore prone to fall.
Demand and supply coming more into line
During the COVID-19 pandemic we saw two opposing forces on prices: first, the supply shock from factory closures and travel restrictions meant supply delays rose to levels not previously recorded. Second, factory closures and reduced consumer and business spending meant demand collapsed.
In the absence of the collapse in demand, the supply shock would have driven up prices. Instead, the impact was contained due to the slump in demand, and prices in fact fell modestly in April and May 2020 as the deflationary pressure from falling demand exceeded the inflationary impact of the supply shock.
More recently, as businesses have reopened, demand and supply have shown signs of coming back into line. The rise in demand for inputs, as factories increasingly restocked their warehouses has helped prices higher on average. Supply chain delays have meanwhile eased but importantly still persist, providing an additional impetus to inflationary pressures.
Whether prices will continue to rise in coming months will naturally depend on the demand and supply fundamentals after the initial rebound from company closures passes. If demand wanes, prices should moderate on average again. The PMI's sub-indices will be instrumental in assessing these changing conditions.
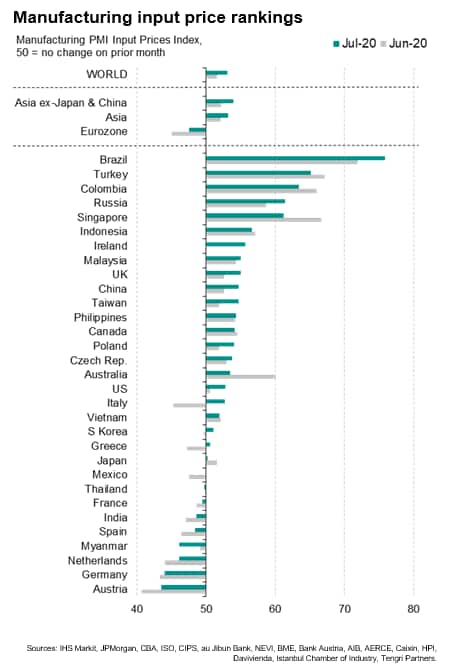
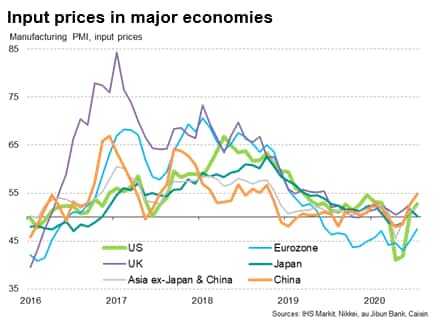
Price trends affected by currencies
An interesting divergence in price pressures has also developed, with producers' input costs continuing to fall in the eurozone but rising at increased rates in other countries such as the US and China, with even stronger rates of increase seen in countries such as Brazil, Turkey and Brazil. These divergences can be at least in part explained by currency movements. The euro has appreciated by around 10% against the US dollar in recent weeks, for example, reducing the effective price of imported commodities which are traded in US dollar terms. Brazil, Turkey, Russia and the US have meanwhile seen their currencies come under pressure, raising import prices.
Chris Williamson, Chief Business Economist, IHS Markit
Tel: +44 207 260 2329
chris.williamson@ihsmarkit.com
© 2020, IHS Markit Inc. All rights reserved. Reproduction in whole
or in part without permission is prohibited.
Purchasing Managers' Index™ (PMI™) data are compiled by IHS Markit for more than 40 economies worldwide. The monthly data are derived from surveys of senior executives at private sector companies, and are available only via subscription. The PMI dataset features a headline number, which indicates the overall health of an economy, and sub-indices, which provide insights into other key economic drivers such as GDP, inflation, exports, capacity utilization, employment and inventories. The PMI data are used by financial and corporate professionals to better understand where economies and markets are headed, and to uncover opportunities.
This article was published by S&P Global Market Intelligence and not by S&P Global Ratings, which is a separately managed division of S&P Global.
{"items" : [
{"name":"share","enabled":true,"desc":"<strong>Share</strong>","mobdesc":"Share","options":[ {"name":"facebook","url":"https://www.facebook.com/sharer.php?u=http%3a%2f%2fssl.ihsmarkit.com%2fmarketintelligence%2fen%2fmi%2fresearch-analysis%2fglobal-producer-prices-show-largest-rise-for-over-a-year-as-demand-revives-Aug20.html","enabled":true},{"name":"twitter","url":"https://twitter.com/intent/tweet?url=http%3a%2f%2fssl.ihsmarkit.com%2fmarketintelligence%2fen%2fmi%2fresearch-analysis%2fglobal-producer-prices-show-largest-rise-for-over-a-year-as-demand-revives-Aug20.html&text=Global+producer+prices+show+largest+rise+for+over+a+year+as+demand+revives+%7c+S%26P+Global+","enabled":true},{"name":"linkedin","url":"https://www.linkedin.com/sharing/share-offsite/?url=http%3a%2f%2fssl.ihsmarkit.com%2fmarketintelligence%2fen%2fmi%2fresearch-analysis%2fglobal-producer-prices-show-largest-rise-for-over-a-year-as-demand-revives-Aug20.html","enabled":true},{"name":"email","url":"?subject=Global producer prices show largest rise for over a year as demand revives | S&P Global &body=http%3a%2f%2fssl.ihsmarkit.com%2fmarketintelligence%2fen%2fmi%2fresearch-analysis%2fglobal-producer-prices-show-largest-rise-for-over-a-year-as-demand-revives-Aug20.html","enabled":true},{"name":"whatsapp","url":"https://api.whatsapp.com/send?text=Global+producer+prices+show+largest+rise+for+over+a+year+as+demand+revives+%7c+S%26P+Global+ http%3a%2f%2fssl.ihsmarkit.com%2fmarketintelligence%2fen%2fmi%2fresearch-analysis%2fglobal-producer-prices-show-largest-rise-for-over-a-year-as-demand-revives-Aug20.html","enabled":true}]}, {"name":"rtt","enabled":true,"mobdesc":"Top"}
]}