Customer Logins
Obtain the data you need to make the most informed decisions by accessing our extensive portfolio of information, analytics, and expertise. Sign in to the product or service center of your choice.
Customer Logins
EQUITIES COMMENTARY
Mar 14, 2023
US Banking sector, what the data shows

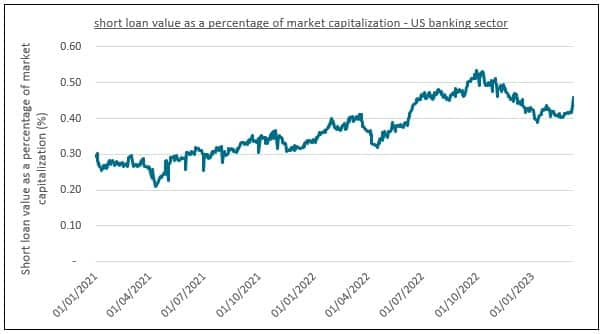
Short interest across the US banking sector has been increasing since 2021.
As the recent demise of regional banks in the US reverberates across the global financial system, short interest across the US banking sector has continued to rise. Over the past year, short loan value as a percentage of market capitalization has increased from 0.29% on January 1st, 2022, to 0.46% on March 10th, 2023.
Many of the most shorted banking stocks within this sector are now household names. Silvergate Capital Corp (SI) and Silicon Valley Bank Financial Group (SVB) are two of these.
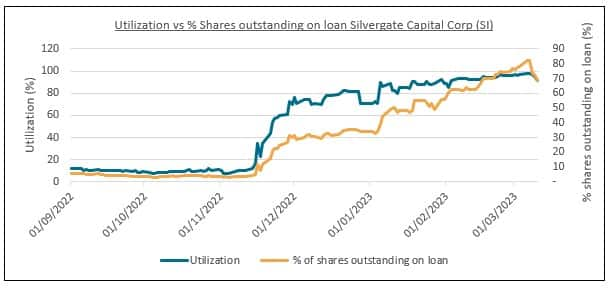
S&P Global Market Intelligence Securities Finance data shows that borrowing activity in Silvergate Capital Corp (SI) gained momentum during November as utilization increased from 10% to 35% overnight on November 16th, 2022. The percentage of shares outstanding on loan reached a peak of 82.4% on March 6th, 2023, just before the bank confirmed that it would be winding down its operations and liquidating its assets on March 8th, 2023.
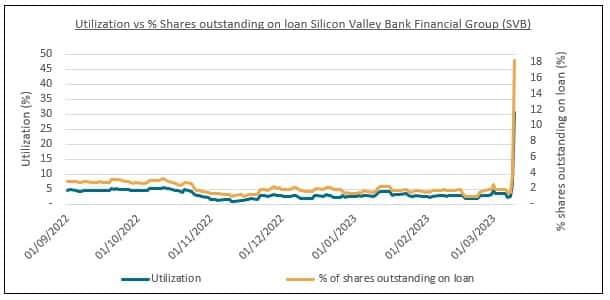
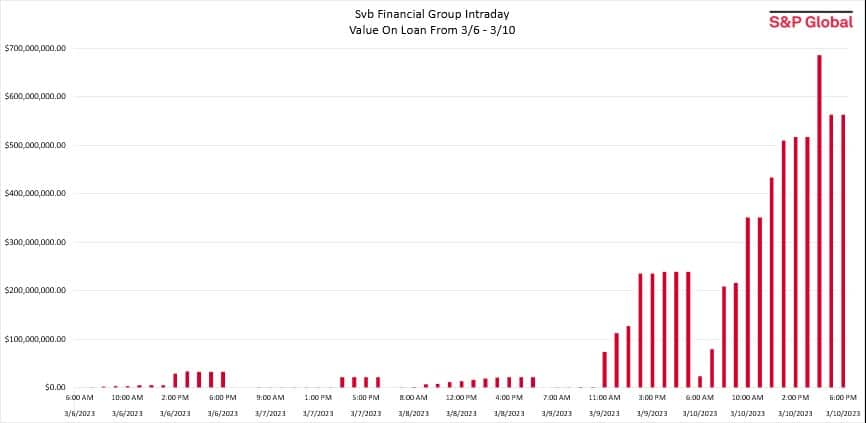
When examining the same metrics across Silicon Valley Bank Financial Group (SVB), the speed of recent events can be clearly seen in the short interest data. Both utilization and the percentage of shares outstanding on loan increased rapidly on March 8th, 2023, as the bank announced its plans to raise capital through the issuance of new equity. On March 10th, 2023, the bank was considered illiquid following a run on its deposits leading to the second largest bank fail in US history.
Across both banks, several factors have been blamed for their liquidations. The rapid increase in interest rates leading to a decline in the value of fixed income investments, a mismatch in duration between deposits and investments, a lack of diversification across their client base and a rapid decline in deposits have all been cited.
Looking across the sector, short interest in the regional banks remains strong as recent declines in share prices have impacted investor confidence. The top twenty most shorted US Banks (ranked by the percentage of outstanding shares on loan) are listed below.
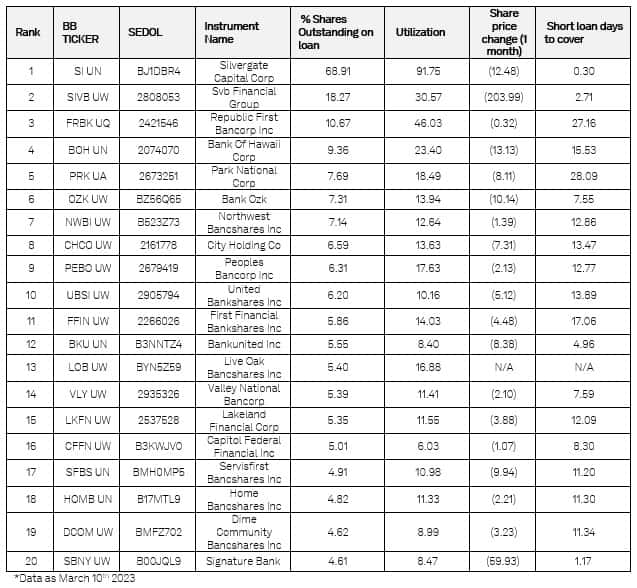
Short loan days to cover = Estimated time to buy back short position, based on current cash market volume. Calculated as the value on loan divided by the 30 trading day cash market turnover, in days.
Utilization = Percentage of actively lendable securities in lending programs which are currently out on loan, calculated as the lender value on loan divided by the active lendable value in %.
S&P Global provides industry-leading data, software and technology platforms and managed services to tackle some of the most difficult challenges in financial markets. We help our customers better understand complicated markets, reduce risk, operate more efficiently and comply with financial regulation.
This article was published by S&P Global Market Intelligence and not by S&P Global Ratings, which is a separately managed division of S&P Global.
{"items" : [
{"name":"share","enabled":true,"desc":"<strong>Share</strong>","mobdesc":"Share","options":[ {"name":"facebook","url":"https://www.facebook.com/sharer.php?u=http%3a%2f%2fssl.ihsmarkit.com%2fmarketintelligence%2fen%2fmi%2fresearch-analysis%2fus-banking-sector-what-the-data-shows.html","enabled":true},{"name":"twitter","url":"https://twitter.com/intent/tweet?url=http%3a%2f%2fssl.ihsmarkit.com%2fmarketintelligence%2fen%2fmi%2fresearch-analysis%2fus-banking-sector-what-the-data-shows.html&text=US+Banking+sector%2c+what+the+data+shows+%7c+S%26P+Global+","enabled":true},{"name":"linkedin","url":"https://www.linkedin.com/sharing/share-offsite/?url=http%3a%2f%2fssl.ihsmarkit.com%2fmarketintelligence%2fen%2fmi%2fresearch-analysis%2fus-banking-sector-what-the-data-shows.html","enabled":true},{"name":"email","url":"?subject=US Banking sector, what the data shows | S&P Global &body=http%3a%2f%2fssl.ihsmarkit.com%2fmarketintelligence%2fen%2fmi%2fresearch-analysis%2fus-banking-sector-what-the-data-shows.html","enabled":true},{"name":"whatsapp","url":"https://api.whatsapp.com/send?text=US+Banking+sector%2c+what+the+data+shows+%7c+S%26P+Global+ http%3a%2f%2fssl.ihsmarkit.com%2fmarketintelligence%2fen%2fmi%2fresearch-analysis%2fus-banking-sector-what-the-data-shows.html","enabled":true}]}, {"name":"rtt","enabled":true,"mobdesc":"Top"}
]}