Customer Logins
Obtain the data you need to make the most informed decisions by accessing our extensive portfolio of information, analytics, and expertise. Sign in to the product or service center of your choice.
Customer Logins
BLOG
Jan 20, 2023
Shore Thing - 2023 Global Trade Themes
The long-awaited downturn in global trade will take place in 2023. Supply chain realignments that have been years in the making will begin to take effect. New research uses S&P Global Market Intelligence's proprietary trade forecasts and bill-of-lading data to unearth the key trends to watch in 2023.
A Year of Two Halves - Trade Forecast for 2023
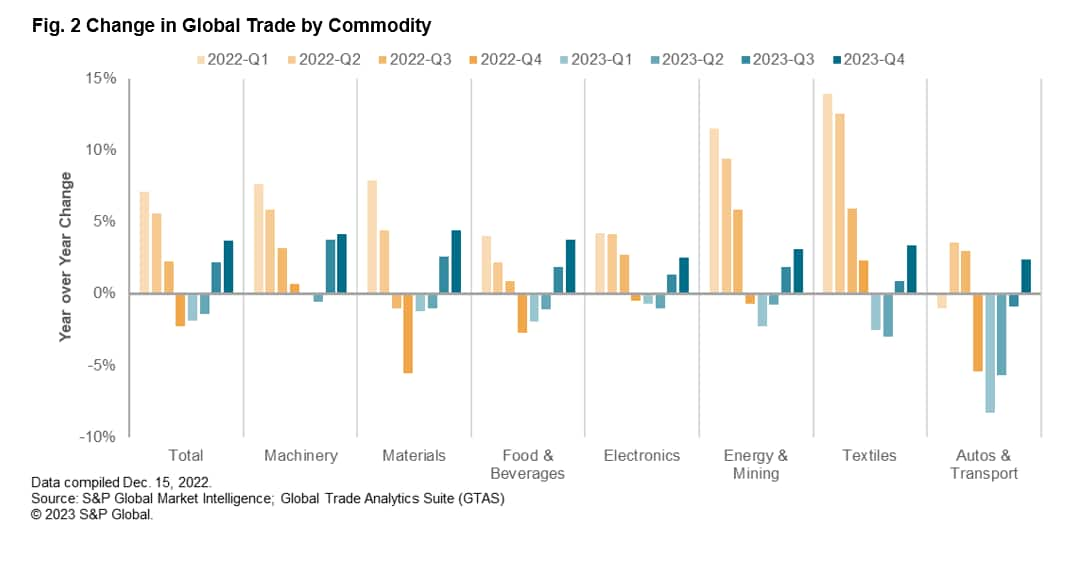
Boom time demand and supply chain inflation will both reverse in 2023, dragging on the volume and value of global trade. S&P Global Market Intelligence's global trade forecasts, shown in Figure 1, find that a downturn in the automotive and consumer goods trade will be offset by machinery and electrical goods.
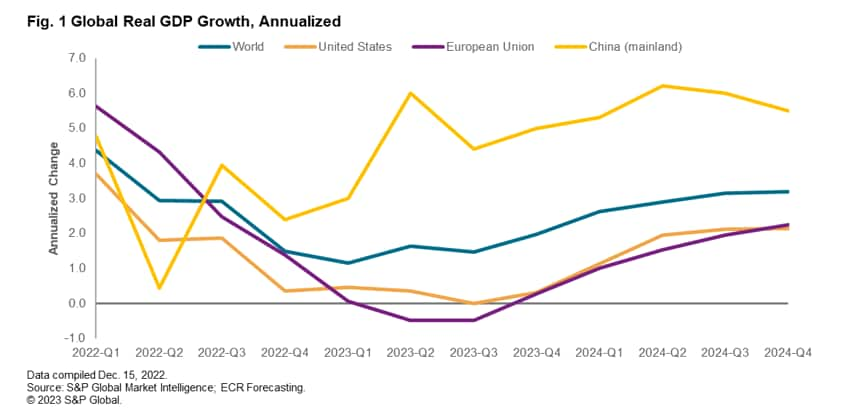
That will be reflected in nation-level performance, with growing exports from China (Mainland) and South Korea outpacing Japan's downturn while EU and U.S. imports will fall.
In aggregate, we forecast global trade activity in real terms will fall by 1.9% year over year in Q1'23 and by 1.4% in Q2'23 before recovering later in the year to reach 0.6% growth overall in 2023.
Subsidies, CBAM, and Sanctions - Policy Backdrop
Government policies launched in 2022 will bear fruit in 2023 and include subsidies for semiconductors and automotive electrification, carbon border taxes, and wider sanctions against Russia's war in Ukraine.
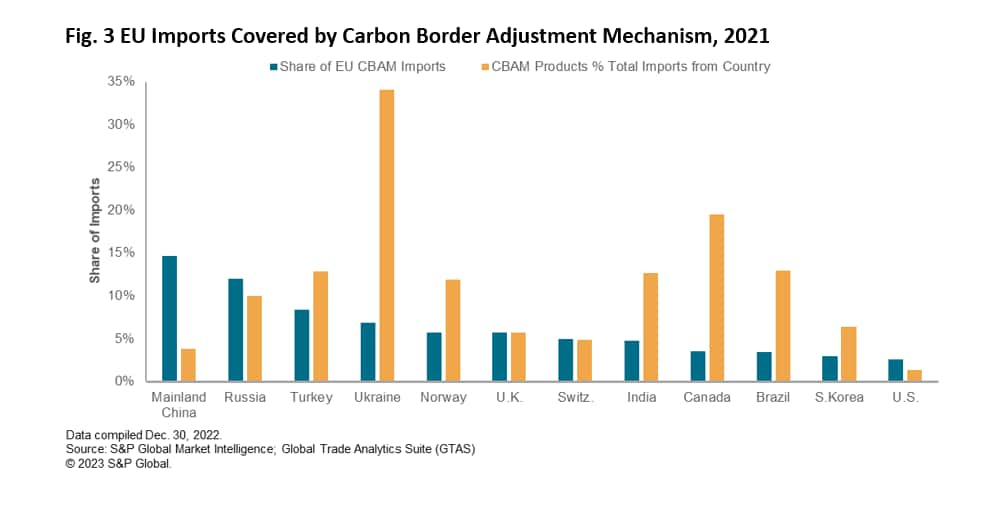
The EU's Carbon Border Adjustment Mechanism could prove to be transformational for supply chain structures over the next decade. By taxing imports based on their carbon content and domestic regulation versus EU-norms, CBAM may require firms to review their sourcing to maintain a competitive advantage.
Figure 3 shows that Mainland China accounted for 15% of EU imports of products affected by the initial CBAM round in 2021, including 17% of iron/steel and 13% of fertilizers. Yet, CBAM only represented 4% of Mainland China's exports to the EU.
The Right Stuff - Inventory Management in Consumer Hardlines
The consumer goods industry has passed through three years of significant upheaval. Inventory strategies, the trade activity supporting them, and corporate investments have had to be adapted to pandemic-era norms.
The first half of 2023 may see a return to normal activity levels, particularly for consumer hardlines which have driven a large part of the boom in global trade. We forecast that U.S. imports of furniture will have dropped by 19% year over year in Q4'22 and by 14% in Q1'23 in response to reduced demand.
The second half of 2023 may reveal the long-term shape of inventory and investment strategies as well as sourcing. While "just in case" strategies may be more appropriate in a post-pandemic era, they cost a lot more than traditional inventory-light approaches.
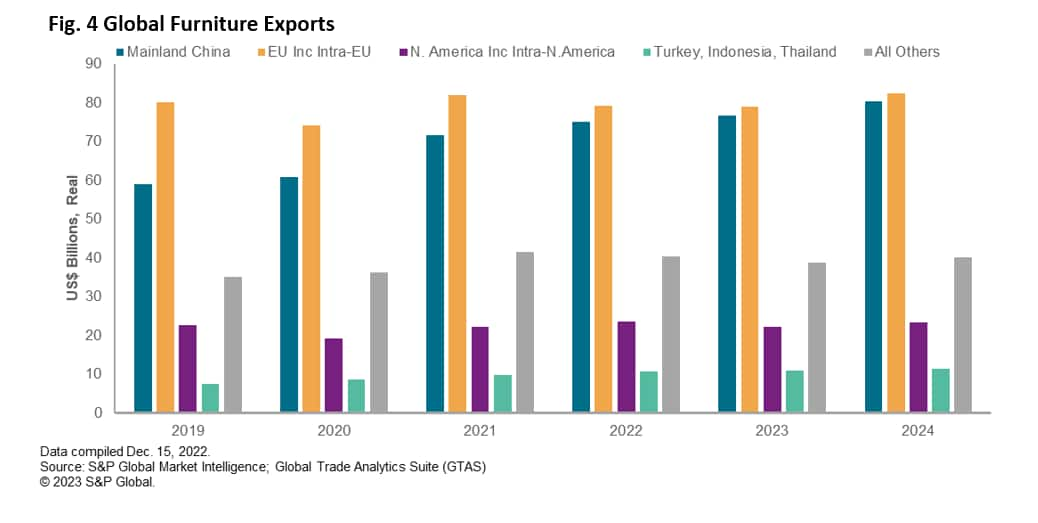
That will make efficient sourcing more important than ever. Figure 4 shows the shifting shape of the global trade in furniture. Mainland China's share of global furniture exports will increase to 34% in 2023 from 29% in 2019.
xShoring Comes into View - Electronics Sourcing Strategies
The pandemic is just the latest driver of corporate decision-making in the sourcing of electronics. There remain many reasons to diversify, particularly away from mainland China, including the disruptions caused by the pandemic, a declining labor cost advantage and geopolitical effects such as tariffs.
2023 will further reveal which strategies and geographies are winners from sourcing diversification, whether that be simple reshoring to cut costs, friendshoring to reduce political risk or onshoring to mitigate logistics risk.
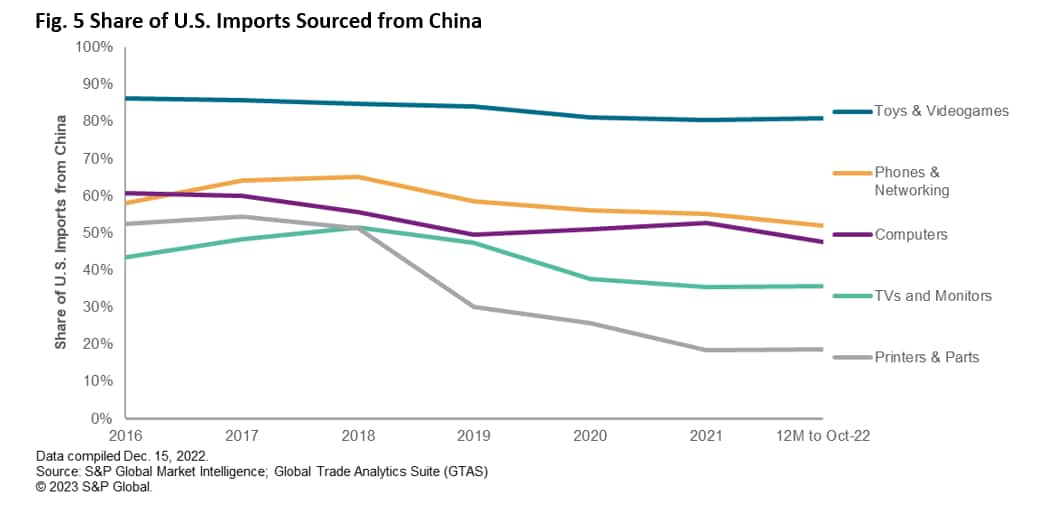
There's already been a significant drift away from Chinese sourcing for U.S. buyers, as shown in Figure 5. Chinese suppliers accounted for 47.5% of U.S. computer imports in the 12 months to Oct. 31, 2022, down from 60.8% in 2016. There have been similar downturns in telecoms, TVs, printers and toys.
India's Big Year - Expanding While Shifting Away from Apparel
India's trade economy is set for rapid growth in 2023, aided by trade activity as the country diversifies its manufacturing base. The active use of trade policy measures under the "Make in India" program is complimented by in-market, for-market manufacturing strategies and the benefit of reshoring away from China.
However, the road is far from smooth, with regulatory, infrastructure, and competitive pressures to deal with.
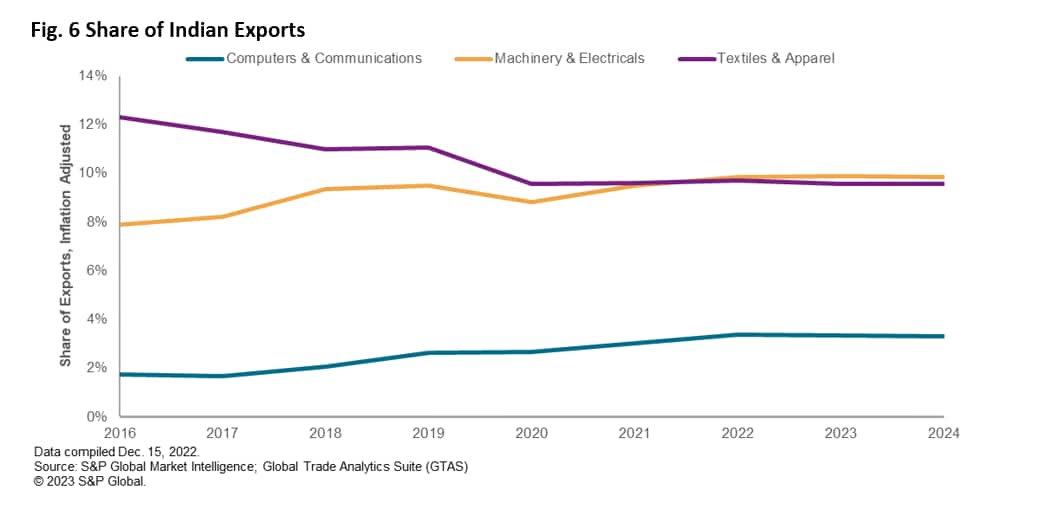
The evolution in India's export economy can already be seen in its trade patterns in Figure 6. The share of machinery and electricals in India's exports overtook the legacy textiles and apparel sectors in 2022 with shares of 9.9% and 9.7% respectively.
Deep Blue Turns Red and Green - Logistics Outlook
The logistics industry has had a boom time for activity and profits in the past three years. That has begun to change in 2023, just as the demands for spending on environmental improvements increase.
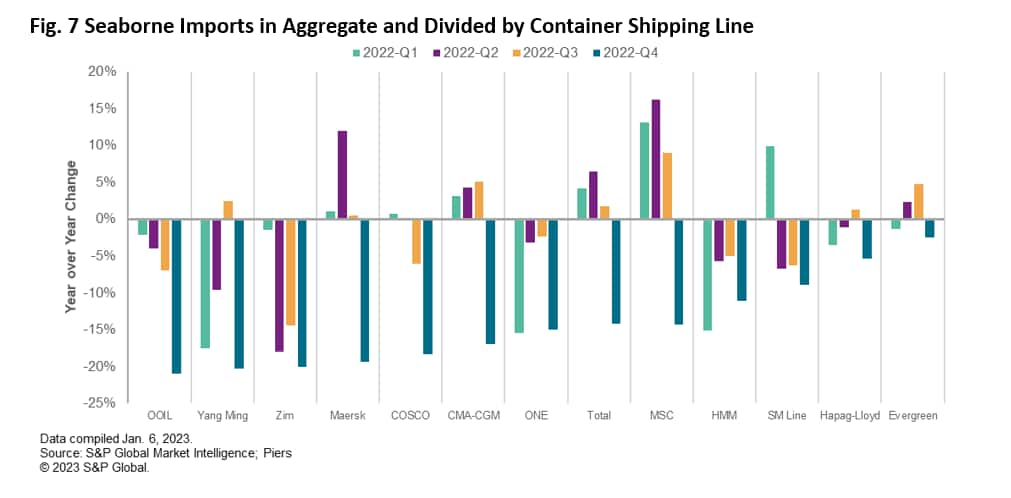
The declining state of the logistics sector can be seen in U.S. seaborne imports of containerized freight, which fell by 14% in Q4'22 versus the year earlier, shown in Figure 7, and were 0.4% below Q4'19's.
Shipping rates have already fallen precipitously, while some container lines are looking to bolster market share as demand declines. Key to the outlook for the logistics sector, aside from demand, is whether supply discipline is maintained through blank sailings and vessel scrapping.
Conflict, Climate, and Cyber - Outlier Considerations for 2023
If we've learned anything in the 2020s so far, it's that supply chains are vulnerable to unexpected, systemic-level shocks. Looking into 2023 we're concerned about low-probability, high-impact risks including potential conflicts in Asia and physical disruptions from environmental and cyber-security factors.
The electronics industry may be one of the most exposed to such outlier risks given the highly integrated nature of the supply chains, the widespread of uses for core technology components, and the high proportion of exports from Asia.
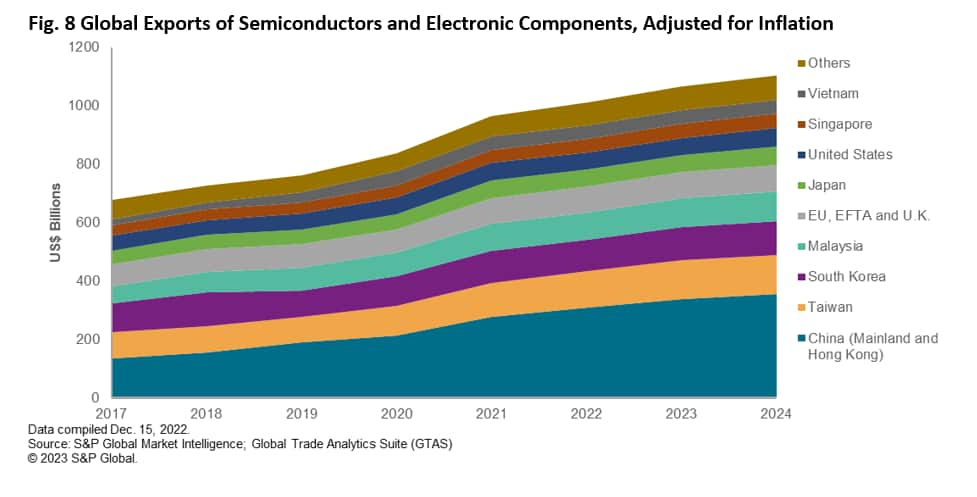
As shown in Figure 8, Taiwan accounted for 12.4% of global exports of semiconductors and electrical components in 2022 while South Korea represented 10.7%.
The full version of this article is available on the Connect platform for S&P Global Market Intelligence clients with a subscription to GTA/GTA Forecasting or GTAS Suite
Subscribe to our monthly newsletter and stay up-to-date with our latest analytics
This article was published by S&P Global Market Intelligence and not by S&P Global Ratings, which is a separately managed division of S&P Global.
{"items" : [
{"name":"share","enabled":true,"desc":"<strong>Share</strong>","mobdesc":"Share","options":[ {"name":"facebook","url":"https://www.facebook.com/sharer.php?u=http%3a%2f%2fssl.ihsmarkit.com%2fmarketintelligence%2fen%2fmi%2fresearch-analysis%2fshore-thing-2023-global-trade-themes.html","enabled":true},{"name":"twitter","url":"https://twitter.com/intent/tweet?url=http%3a%2f%2fssl.ihsmarkit.com%2fmarketintelligence%2fen%2fmi%2fresearch-analysis%2fshore-thing-2023-global-trade-themes.html&text=Shore+Thing+-+2023+Global+Trade+Themes+%7c+S%26P+Global+","enabled":true},{"name":"linkedin","url":"https://www.linkedin.com/sharing/share-offsite/?url=http%3a%2f%2fssl.ihsmarkit.com%2fmarketintelligence%2fen%2fmi%2fresearch-analysis%2fshore-thing-2023-global-trade-themes.html","enabled":true},{"name":"email","url":"?subject=Shore Thing - 2023 Global Trade Themes | S&P Global &body=http%3a%2f%2fssl.ihsmarkit.com%2fmarketintelligence%2fen%2fmi%2fresearch-analysis%2fshore-thing-2023-global-trade-themes.html","enabled":true},{"name":"whatsapp","url":"https://api.whatsapp.com/send?text=Shore+Thing+-+2023+Global+Trade+Themes+%7c+S%26P+Global+ http%3a%2f%2fssl.ihsmarkit.com%2fmarketintelligence%2fen%2fmi%2fresearch-analysis%2fshore-thing-2023-global-trade-themes.html","enabled":true}]}, {"name":"rtt","enabled":true,"mobdesc":"Top"}
]}


