Customer Logins
Obtain the data you need to make the most informed decisions by accessing our extensive portfolio of information, analytics, and expertise. Sign in to the product or service center of your choice.
Customer Logins
BLOG
Sep 03, 2020
Post-Brexit Tariff Change for British Imports from China
Using Trade Data for Post-Brexit Plan
Trade statistics at different HS Code granularity levels or different classifications using data from GTA could provide insight into tariff change implication.
- The EU is the largest import trade partner, with over 50% of the total UK's imports are from European Economies. As the UK is leaving the EU, the deprived membership benefits would possibly incur additional cost for the UK to import from EU countries in the future unless another trade deal is settled.
- China, as the third import partner, accounts for over 9% of UK total imports, will be potentially gaining some benefits from new tariff arrangement. Circa 11% of the UK's imports from China will enjoy the benefits from zero tariffs by going liberal, under the current arrangement plan.
- There are products like kitchenware, televisions and digital cameras under the 'liberal' list that have a high trade value and where China is a market leader. For other products, like turbojet parts, China is not a significant supplier in terms of absolute value compared to the EU and US. Yet, the 100% coverage of zero tariffs on this category is also likely to benefit China.
- Agri products, including yeasts and plantation exports from China could benefit from a reduction in tariffs. Though the trade value of specific product category is not significant, owing to the decrease in tariffs from over 10% to zero, traders of these products could see some cost-saving and benefit from larger volumes due to the lower rates.
Purely from the trade statistics point of view, manufacturing and traders of households/kitchen, the digital products, and the agriculture sectors may enjoy direct 'zero-tariff' benefits.
Apart from the 'liberal' zero tariff change, trade from China could benefit from 'reduced' and 'simplify' tariff segments. GTA can be used to identify precise sectors that would benefit along with upstream and downstream impact due to the tariff changes. GTA's ability to target by HS Code at tariff line level and its customised grouping and classification are useful to analysts researching either corporate or macro-level changes. The potential of import trade structure and shift in the supply chain could result in changes to ocean carrier shipping network, as well as a capital investment in facilities and infrastructure.
Introduction
On May 19, 2020, the UK Government announced a new Post-Brexit tariff arrangement, valid from January 1, 2021, setting out four types of tariff changes, broadly classified as:
- Liberalised: meaning the tariff has been reduced to zero.
- Simplified: meaning the tariff has been rounded down or 'banded'. For some complex tariffs this means the tariff is now expressed as a single percentage.
- Reduced: meaning the tariff has been lowered beyond the simplification measure.
- Currency conversion: meaning that tariffs have been converted at an exchange rate of €1 = 0.83687 GBP. After this conversion, rates equal to or over £10 have been rounded down to the nearest whole pound. Rates under £10 have been rounded down to the nearest 10 pence.
"From Jan 1 2021, the UK will apply a UK-specific tariff to imported goods. This UK Global Tariff (UKGT) will replace the EU's Common External Tariff, which applies until Dec 31 2020. The government ran a consultation to inform development of the UKGT. "
(Full announcement: https://www.gov.uk/guidance/uk-tariffs-from-1-january-2021)
Among these, the 'liberalised' (indicating zero duty) classification, is the most favourable to both domestic importers and overseas exporters.
UK Import Trade Overview
China is UK's third largest import trade partner in recent years holding steady at 9% market share. While trade talks around 'Brexit' mostly centred on the trade relationship between the UK and the EU, it is also worth looking at which specific products will fall under the 'liberalised' category. China may end up benefiting from benefiting from this new regime due to its cost competitiveness.
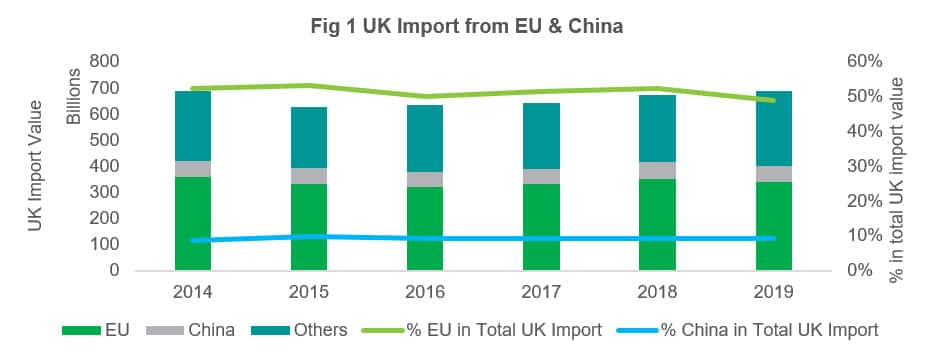
Source: IHS Markit Global Trade Atlas
In 2019, the UK's top 15 import trade partners represented more than 70% of the total UK's imports, among which eight were from the EU. Germany is the largest import origin country, accounting for 12.3% of UK imports, followed by the United States and China. Within the EU, Netherlands, France and Belgium are also among the major import partners.
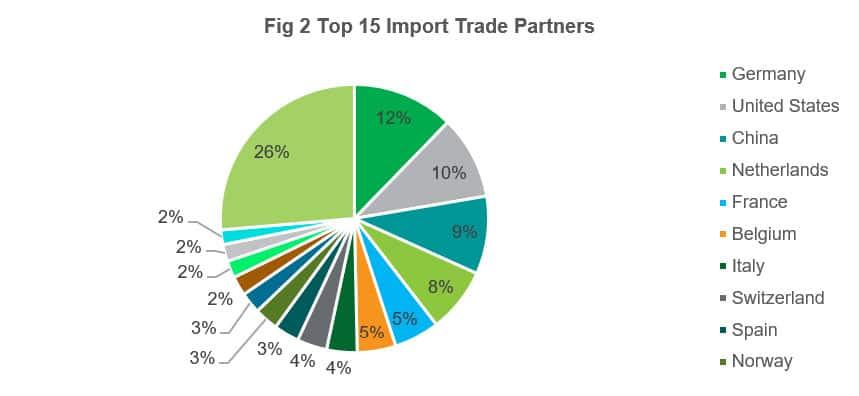
Source: IHS Markit Global Trade Atlas
In terms of trade with China, Electrical machinery and equipment (HS Chapter 85) is the largest commodity group with 17.39 billion USD in 2019, accounting for 27% of total import value from China; followed by Machinery and Mechanical Appliances (HS 84). Both are electrical and mechanical sector; furniture, toys and apparel articles are also among the top five categories.
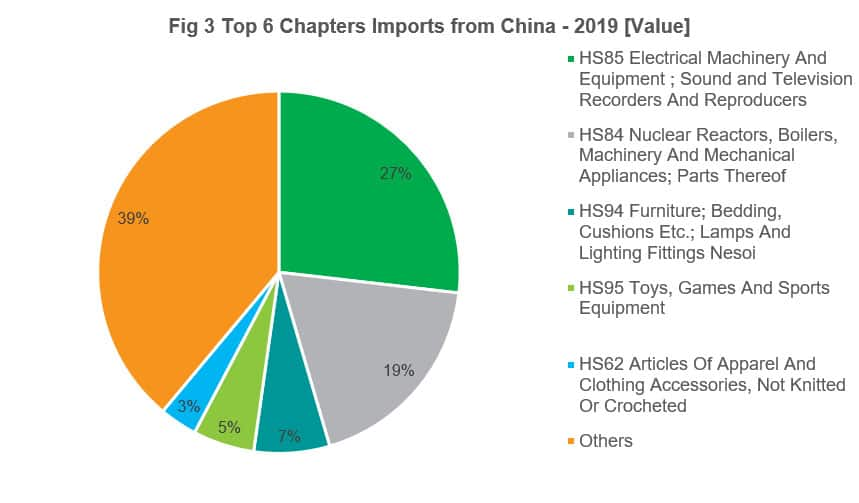
Source: IHS Markit Global Trade Atlas
Looking at the more detailed six-digit HS Code Level beneath these chapters (Table 1), we can see that electrical and machinery products are still the majority in terms of trade value. It is also interesting to note that certain consumer products such as furniture (HS94) and toys, games & sports equipment (HS95) are also notable categories when looking at UK Imports from China.
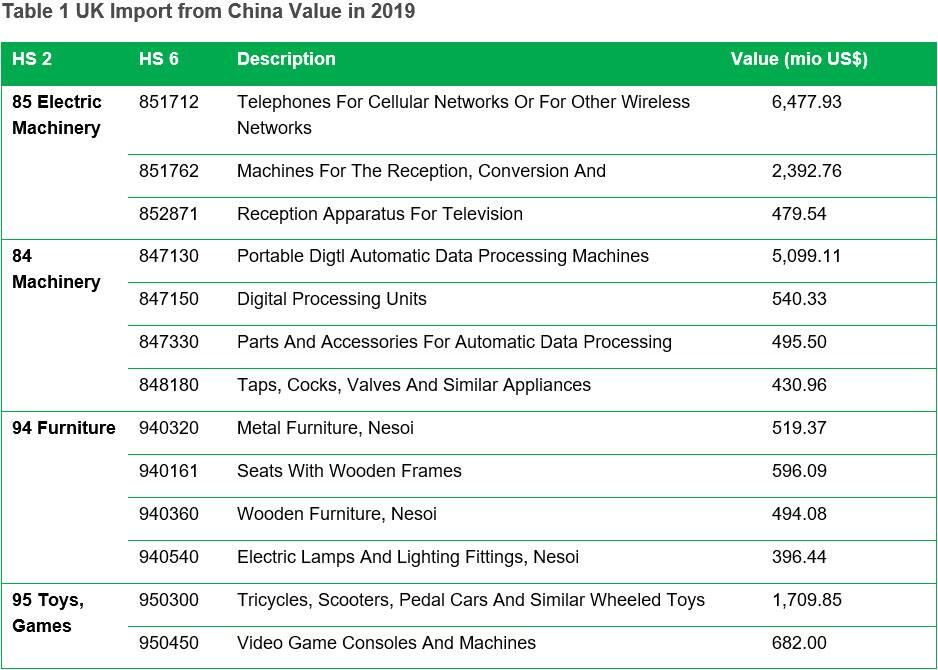
Source: IHS Markit Global Trade Atlas
Uncovering the relevance of to be 'liberalised' products
With IHS Markit's expertise and data analytical skills, we've come to realise that HS codes could be mapped, grouped and classified into sector-based categories to derive further insights into various industries. Below we explore such a mapping, applied to national statistical trade for the United Kingdom.
Scoping the UK import trade with China, we firstly looked at commodities under the 'liberalised" arrangement at both aggregated levels (such as HS2/Header levels) but also drilling down into the more granular classifications (National Codes/Tariff Lines) to identify the top traded items in terms of value. The mapping is applied to the tariff line product codes that are listed as to be 'liberalised' in the new tariff regime.
A total of 2,001 items were mapped into 12 commodity groups devised by IHS Markit. These include Chemicals, Transport, Machinery/ Electrical, Textile, Animal/Food Stuff, to name a few. Looking at the import structure of these products in 2019, the machinery classification accounts for 53.15% of total UK Imports of goods which were noted as 'liberalised', followed by transport (17.06%) and metals (10.53%). The full distribution of the commodities group is shown in Figure 2 below. We then analysed their import dependencies and alternative sourcing markets other than China to scope out the competitive landscape as well as see who would benefit from zero tariffs.
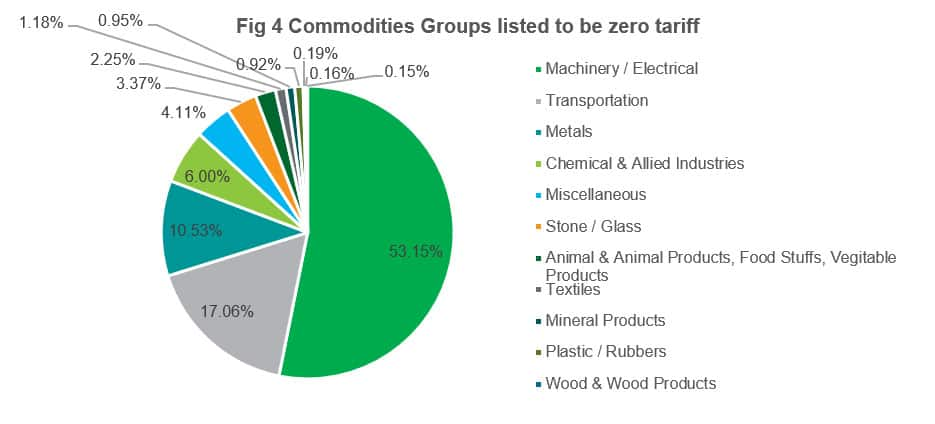
Source: Adapted from IHS Markit Global Trade Atlas, with ref to UK HMRC Tariff Regime
Supply chains of those to be 'liberalised' commodities
Tariff line item codes listed as to be liberalised mapped for each of the commodity groups, and government agencies use tools like GTA help to establish the supply chains on a macroeconomic basis between countries - this exact type of data in the devising of tariff schedules. Unsurprisingly, the UK is highly dependent upon trade with the EU (which accounts for more than 50% of its imports), this mostly consists of food related goods, chemicals & plastics, as well as wood and raw hide/fur (Figure 3 & Figure 4).
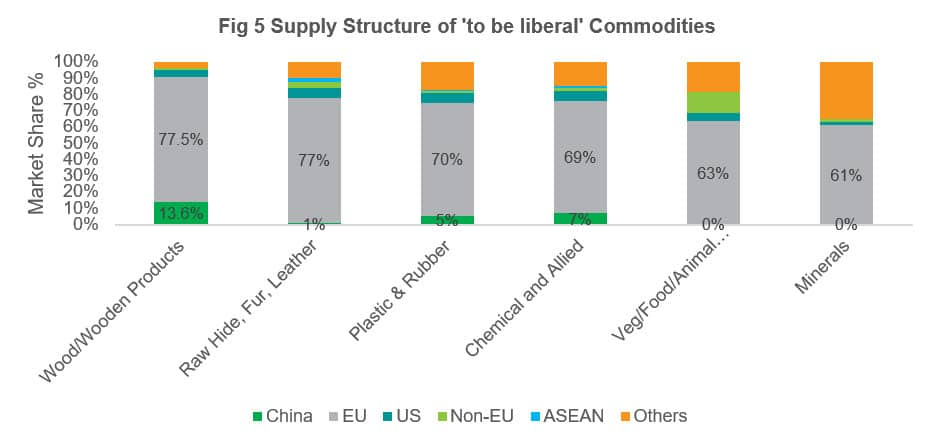
Source: IHS Markit Global Trade Atlas
In terms of China, however, there're a few commodity groups where China plays an important role, for example delivering 34% of footwear & headgear products into the UK, with some notable share in textile, machinery/electrical, stone/glass and metal products.
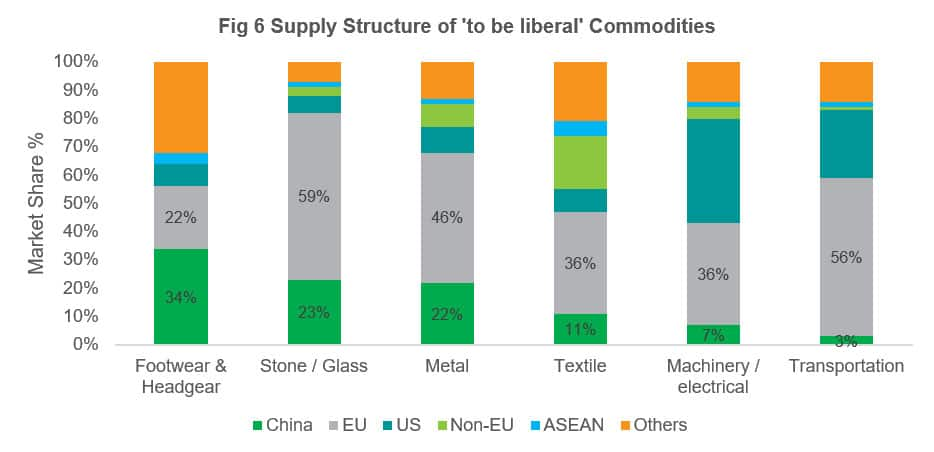
Source: IHS Markit Global Trade Atlas
When comparing these various geographies we see that within other commodities groups (i.e. food/vegetables, minerals), the EU and US are the predominant supplier markets to the UK and that China has a minimal market share (<5%). Therefore, any change to tariffs which will impact the EU supplier base might prove beneficial for those commodities which could be alternatively sourced from China.
The scale and scope of imports from China to be zero tariff
In anticipation of these reductions in tariffs, we can apply the devised scheme to 2019 data to try and understand the market share of goods that are due to fall under zero-tariff category (i.e. to be 'liberal') across all commodities imported from China to the UK. An astounding 11% or (USD7.19 Billion in goods for 2019) fall under this new scheme. We can also further evaluate the 'relative' value for each HS chapter by aggregating the HS8 level codes, otherwise known as Tariff Lines/National Codes as this is the level at which tariffs are placed.
In terms of the absolute value covered by to be 'liberalised', HS Chapters 84 and 85 which refer to machinery and electronic equipment are at the top of the list with US$ 2.08 billion and US$ 1.07 billion imports (2019). Other HS chapters with significant trade value include iron steel products (HS 73), article of base metal (HS 83) and glassware (HS 70).
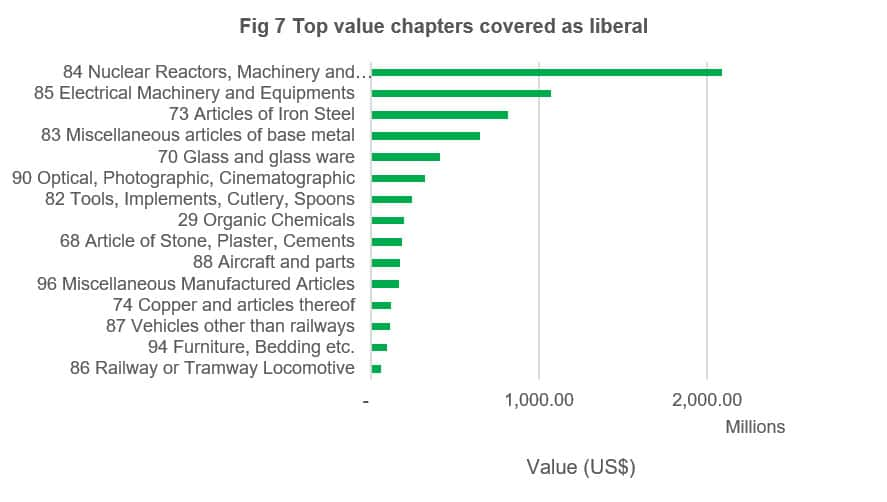
Source: IHS Markit Global Trade Atlas
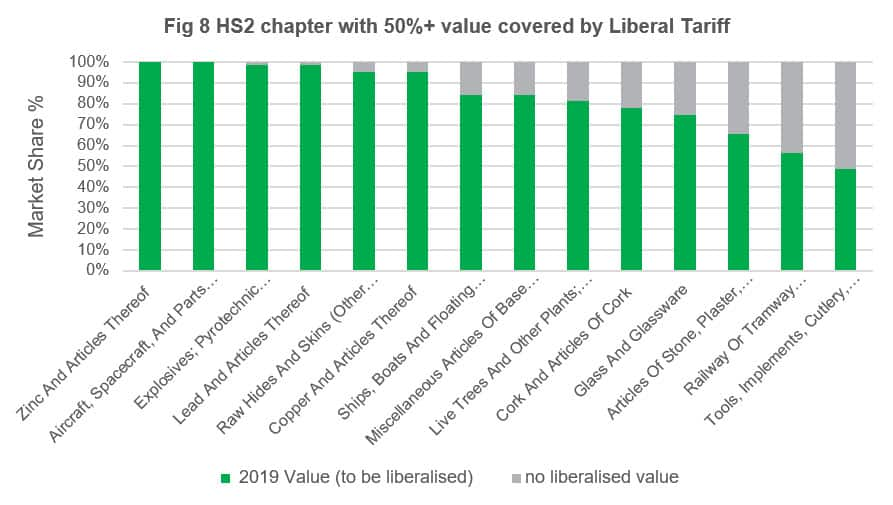
Alternatively, to identify areas of potential diversification, we can explore by Chapter the percentage share by value of goods eligible to zero tariffs. Of these, zinc and aircraft parts are fully covered by the 'liberalised' scheme. As previously mentioned, zero tariffs can benefit other economies through diversifications; it might be that due to already established tariffs, it was preferential to trade with the EU for certain commodities, whereas this liberalisation could allow for further exploration and sourcing from Asia.
Source: IHS Markit Global Trade Atlas
Alternative import origins
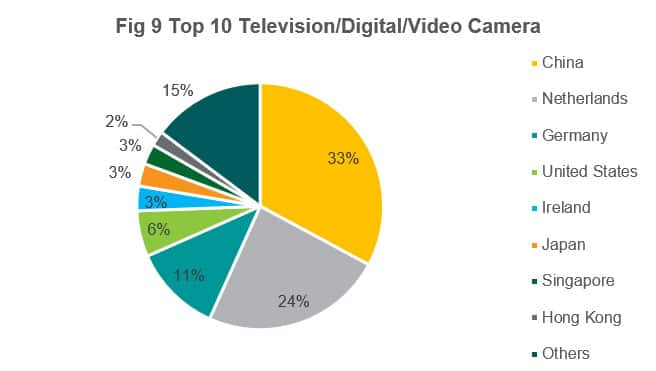
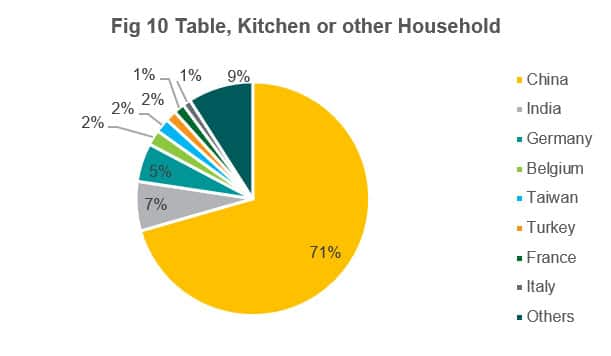
Household goods, turbojets and parts, and television/digital/video cameras are the top three product categories (in terms of UK imports from China trade value) that fall under the zero tariffs scheme. China is the top supplying market for table, kitchen and other household goods (HS 732393, 732399) as well as television/digital/video cameras (852580), representing 71% and 33% of the supply market share respectively.
Source: IHS Markit Global Trade Atlas
Source: IHS Markit Global Trade Atlas
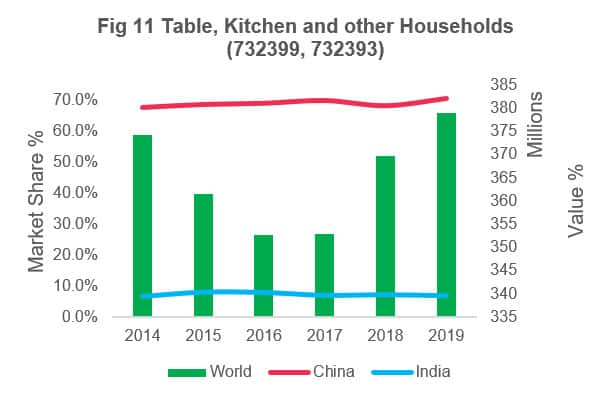
Looking at the trade pattern for these three groups of products in the last six years, China's market share in table, kitchen and other households products sit relatively stable at ~70%, far ahead of other markets. The second supplying origin, India, accounts for around 7% annual UK imports.
Source: IHS Markit Global Trade Atlas
While in digital/television camera items, we can see rapid growth leading to an increase in dependency between 2015 and 2019, while the Netherlands declined in supply, thus overpassing the latter since 2017 to become the largest supplying market.

Source: IHS Markit Global Trade Atlas
For turbojets and parts thereof, where the US and EU dominate the supply chain, we can see China hold a relatively minor share of the market, but similarly to the electrical (i.e. 852580) goods mentioned above, appears to be experiencing rapid growth in recent years.
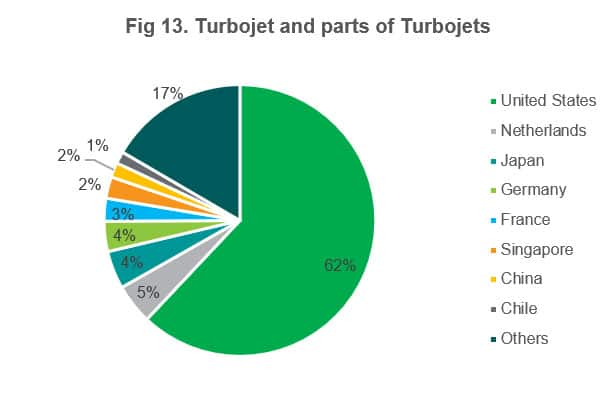
Source: IHS Markit Global Trade Atlas
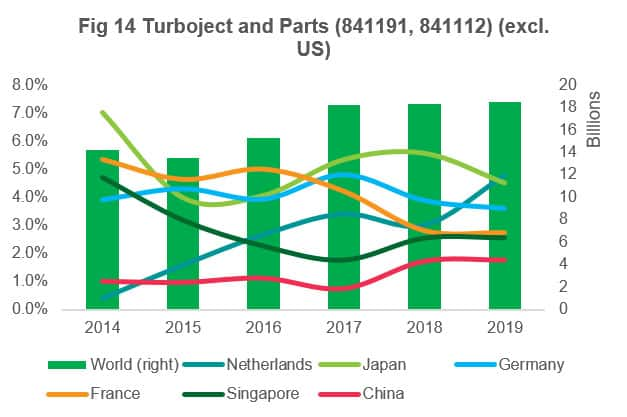
Source: IHS Markit Global Trade Atlas
Specific items eligible to favourable tariff condition
Another dimension is to review those 'to be liberalised' tariff line products that currently have tariff rates ranging from 0.7% - 18% (by value). For commodities with current tariff rate >=10%, agri-products and plantations are among those top imported commodities. In the chart below, the darker colour indicates a higher current tariff rate, while the size of block measures import value in the year 2019 from China. Among these, active yeasts (HS: 21021090) currently is charged at a 14.3% tariff rate, napkins or other textile materials with 10.5% tariff to be which may be wiped out. While the absolute trade amount is not as significant, the relative effects on trade cost would be more evident to those involved in the specific trade activities.
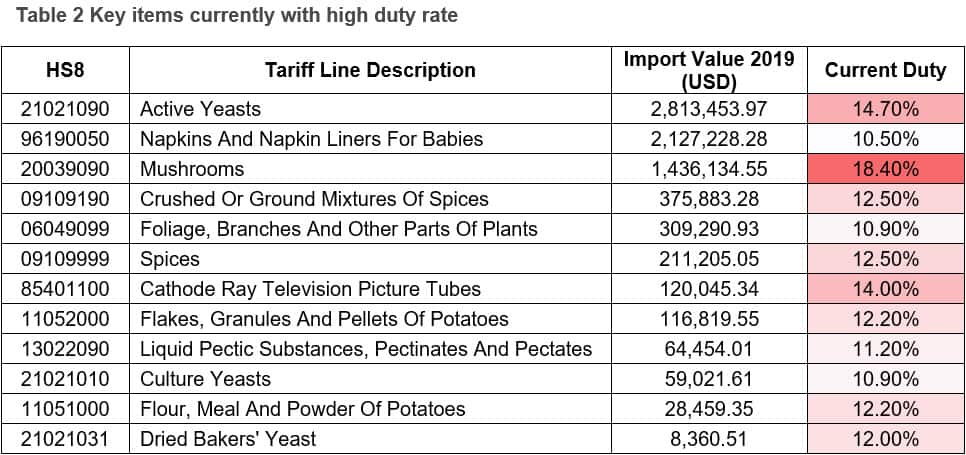
Source: IHS Markit Global Trade Atlas
Corporate level impact
At first sight, Brexit has caused a few worries among enterprises as they will be paying tariffs when importing raw material or finished good from EU partners. However, with the new tariff regime, there could be some favourable impact on companies who are importing products listed as 'liberalised' from alternative trade partners (such as China). These include "table, kitchen and other household product (HS: 73239300)" which we've established is a standard consumer product.
Using GTA data for analysis at different HS levels, along with proper tariff line mapping and the trade concepts reported (Quantity, Value, Unit Price, Trade Partner & Direction), corporate supply chain departments could be more aware of the global production geographies, flows of trade or total trade cost, for example, procurement may use these analysis in estimating the scale of cost impact, looking for cost saving opportunities and multi sourcing options.
IHS Markit trade data solutions along with insight and expertise into industries can help identify trade trends from macro, sectorial to micro levels, capture cost efficient opportunities, analyse value chain dynamics and evaluate facilitation measure effectiveness.
Subscribe to our monthly newsletter and stay up-to-date with our latest analytics
{"items" : [
{"name":"share","enabled":true,"desc":"<strong>Share</strong>","mobdesc":"Share","options":[ {"name":"facebook","url":"https://www.facebook.com/sharer.php?u=http%3a%2f%2fssl.ihsmarkit.com%2fmarketintelligence%2fen%2fmi%2fresearch-analysis%2fpostbrexit-tariff-change-for-british-imports-from-china.html","enabled":true},{"name":"twitter","url":"https://twitter.com/intent/tweet?url=http%3a%2f%2fssl.ihsmarkit.com%2fmarketintelligence%2fen%2fmi%2fresearch-analysis%2fpostbrexit-tariff-change-for-british-imports-from-china.html&text=Post-Brexit+Tariff+Change+for+British+Imports+from+China+%7c+S%26P+Global+","enabled":true},{"name":"linkedin","url":"https://www.linkedin.com/sharing/share-offsite/?url=http%3a%2f%2fssl.ihsmarkit.com%2fmarketintelligence%2fen%2fmi%2fresearch-analysis%2fpostbrexit-tariff-change-for-british-imports-from-china.html","enabled":true},{"name":"email","url":"?subject=Post-Brexit Tariff Change for British Imports from China | S&P Global &body=http%3a%2f%2fssl.ihsmarkit.com%2fmarketintelligence%2fen%2fmi%2fresearch-analysis%2fpostbrexit-tariff-change-for-british-imports-from-china.html","enabled":true},{"name":"whatsapp","url":"https://api.whatsapp.com/send?text=Post-Brexit+Tariff+Change+for+British+Imports+from+China+%7c+S%26P+Global+ http%3a%2f%2fssl.ihsmarkit.com%2fmarketintelligence%2fen%2fmi%2fresearch-analysis%2fpostbrexit-tariff-change-for-british-imports-from-china.html","enabled":true}]}, {"name":"rtt","enabled":true,"mobdesc":"Top"}
]}


