Customer Logins
Obtain the data you need to make the most informed decisions by accessing our extensive portfolio of information, analytics, and expertise. Sign in to the product or service center of your choice.
Customer Logins
BLOG
Apr 29, 2024
Peak China economic prospects

Learn more about our economic forecasting and analysis
Mainland China's COVID containment policy, property sector woes and economic rivalry with the US have significantly increased uncertainty about its long-term economic prospects. Some forecasters who previously projected the size of mainland China's economy to soon surpass that of the US are now expecting this catch up will either take much longer or may never happen.
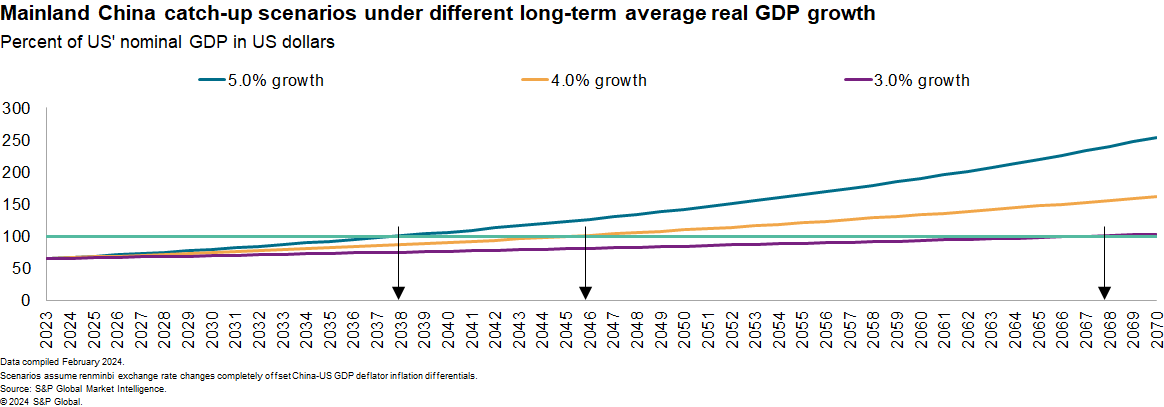
Whether mainland China's growth rate settles at 5% or 3% would have significant implications for the global economic center of gravity. We consider three possible scenarios for growth to gauge if or when mainland China's GDP will exceed US GDP in nominal US dollars.
Different scenarios for growth
For these scenarios, let's assume the US' potential real GDP growth rate to be 2.0%. For simplicity, let's also assume that movements of the Chinese currency's exchange rate vis-à-vis the US dollar will offset the relative inflation rate difference between China and the US. This assumption follows the principle of relative purchasing power parity. Real-world examples of offsetting exchange rate and inflation are most clear in cases of economies undergoing hyperinflation. When an economy suffers hyperinflation, such as Venezuela, its currency drastically loses purchasing power and suffers extreme depreciation.
Under these assumptions, if China can maintain 5% real GDP growth — around its current potential growth — its GDP will surpass US GDP by 2038. If China grows by a more moderate 4% over the long term, its GDP will exceed that of the US eight years later, in 2046. Should China grow by a much weaker 3% annual rate in the long term, the size of its economy will only become larger than that of the US by 2068. In other words, if mainland China's long-term growth rate drops 2.0 percentage points from its current growth, it would take 30 more years for its economy to catch up to the US in size.
Benchmarks for growth
We also examined economic growth experiences across the world in this range of growth rates to put these scenarios in context.
Apart from mainland China, 178 economies have reported real GDP data from 1990 onwards. Between 1990 and 2019, about 60% of these economies achieved moderate to high annual growth rate of at least 3%. The median annual growth rate was 3.6%.
Some of the faster-growing economies during this period include Bangladesh, whose economy grew by 5.6% on average annually during this period, and Pakistan, whose real GDP grew by more than 4% on average.
China's economic growth rate has more than halved since the late 2000s. Such a sharp growth slowdown also raises questions about the economy's long-term growth prospects: Is this slowdown unusual? Does it portend a further drastic long-term growth downshift?
It is helpful to compare China's growth path with that of South Korea, which successfully transitioned from developing to advanced economy status.
The World Bank declared that mainland China had reached the middle-income level in 1997. Using real per capita GDP in 2019 US dollars, South Korea reached China's 1997 per capita GDP in 1969. Looking at China's real GDP between 1997 and 2019 (before the pandemic) and the real GDP of South Korea over its comparable economic development period, the two economies' growth paths are extremely similar until the last five years of this development period. During this five-year period, South Korea's real GDP had advanced noticeably higher than that of China. That is, had China followed the same growth trajectory of South Korea, by year 22 after reaching the middle-income level, China's economy would have been 18% larger.
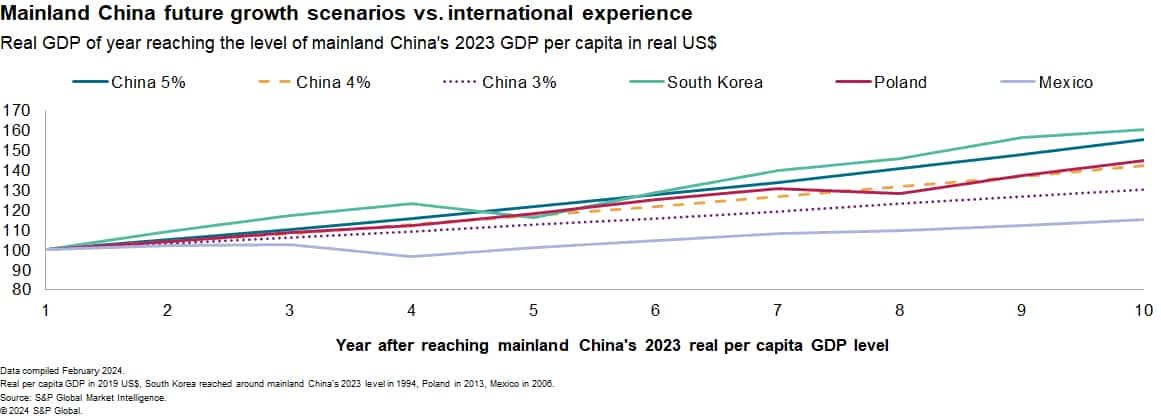
To assess mainland China's growth prospects based on other economies' development experience, let's use South Korea, Poland and Mexico as benchmarks for high-, moderate- and low-growth economies. We compared these economies' real GDP growth paths after reaching the real per capita GDP that China reached in 2023. Specifically, South Korea reached roughly the same level of mainland China's 2023 real per capita GDP in 1994, Poland in 2013 and Mexico in 2006.
If mainland China can maintain 5% annual growth, its development path over the next 10 years will still track below South Korea's path over its comparable development period (1994 to 2003). Should China's potential growth slow to 4%, it will resemble Poland's growth path since the early 2010s. Mexico's post-2006 growth provides a benchmark for stagnant developing economies, as that country's real GDP growth averaged only 1.5% between 2007 and 2019.
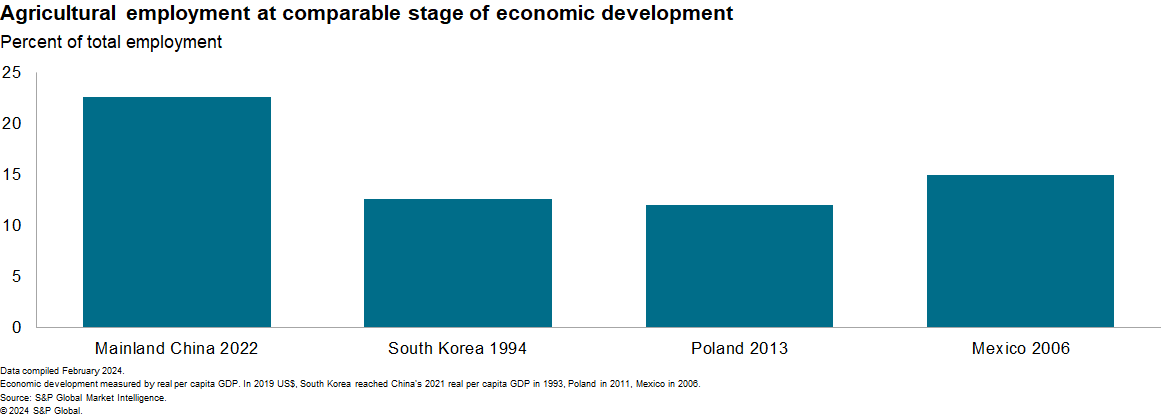
While mainland China faces long-term economic growth headwinds, such as an aging population, the country also possesses underutilized resources that can help sustain robust growth, such as its still-large agricultural labor force. A key driver for developing economies to generate robust growth is effective reallocation of their labor force from the low value-added agricultural sector to the higher value-added industrial and service sectors. And China's current agricultural labor share is much higher than those of South Korea, Poland and Mexico when these economies reached China's 2023 real per capita income.
The likelihood of peak China, while not insignificant, should not be exaggerated.
Learn more about our data and insights
This article was published by S&P Global Market Intelligence and not by S&P Global Ratings, which is a separately managed division of S&P Global.
{"items" : [
{"name":"share","enabled":true,"desc":"<strong>Share</strong>","mobdesc":"Share","options":[ {"name":"facebook","url":"https://www.facebook.com/sharer.php?u=http%3a%2f%2fssl.ihsmarkit.com%2fmarketintelligence%2fen%2fmi%2fresearch-analysis%2fpeak-china-economic-prospects.html","enabled":true},{"name":"twitter","url":"https://twitter.com/intent/tweet?url=http%3a%2f%2fssl.ihsmarkit.com%2fmarketintelligence%2fen%2fmi%2fresearch-analysis%2fpeak-china-economic-prospects.html&text=Peak+China+economic+prospects++%7c+S%26P+Global+","enabled":true},{"name":"linkedin","url":"https://www.linkedin.com/sharing/share-offsite/?url=http%3a%2f%2fssl.ihsmarkit.com%2fmarketintelligence%2fen%2fmi%2fresearch-analysis%2fpeak-china-economic-prospects.html","enabled":true},{"name":"email","url":"?subject=Peak China economic prospects | S&P Global &body=http%3a%2f%2fssl.ihsmarkit.com%2fmarketintelligence%2fen%2fmi%2fresearch-analysis%2fpeak-china-economic-prospects.html","enabled":true},{"name":"whatsapp","url":"https://api.whatsapp.com/send?text=Peak+China+economic+prospects++%7c+S%26P+Global+ http%3a%2f%2fssl.ihsmarkit.com%2fmarketintelligence%2fen%2fmi%2fresearch-analysis%2fpeak-china-economic-prospects.html","enabled":true}]}, {"name":"rtt","enabled":true,"mobdesc":"Top"}
]}