Global price pressures cool further as end of 2022 sees manufacturers cut capacity: 10 key charts
Global manufacturing output fell for a fifth successive month in December 2022, according to the JPMorgan Global Manufacturing Purchasing Managers' Index™ (PMI™) compiled by S&P Global, driven by an accelerating rate of decline of order books.
In a marked contrast to earlier in the year, when manufacturing conditions were characterised by firms struggling to source sufficient quantities of raw materials and labour, the end of 2022 saw increasing evidence of producers cutting back sharply on input purchases and reducing headcounts amid growing signs of slumping demand and excess capacity.
The upsides to falling demand and spare capacity were fewer supply constraints and a further marked moderation of price pressures. These improving inflation signals, as well as reduced COVID-19 restrictions in mainland China, helped bolster business confidence in the year ahead, albeit with sentiment continuing to run below the survey's long-run average.
These developments are explored further below in 10 key charts from our December manufacturing PMI surveys.
Chart 1: Global factory output decline extends to fifth month
The global manufacturing PMI Output Index, which acts as a reliable advance indicator of actual worldwide output trends, signalled a fifth consecutive monthly decline in worldwide factory production in December.
Global manufacturing output
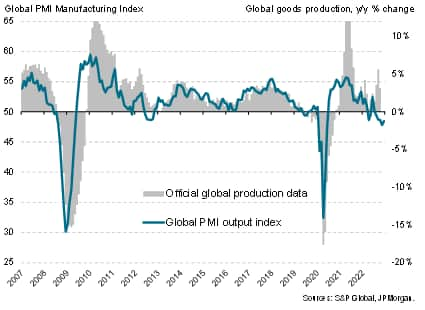
Although the rate of decline moderated, the pace of contraction remained steeper than at any time since 2009, which was during the global financial crisis, excluding the initial pandemic lockdown months in early 2020.
Chart 2: South Asia bucks global downturn
By region, Asia ex-Japan and China bucked the global downturn, with output growth accelerating slightly at the end of 2022. Rates of contraction meanwhile quickened in the US and UK but moderated in the eurozone, mainland China and Japan.
Manufacturing output in key economies
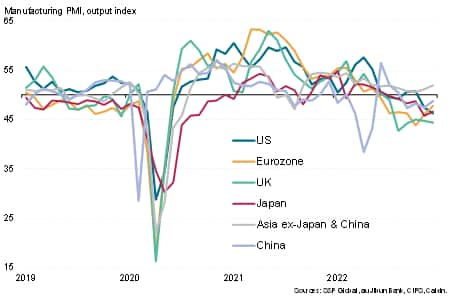
Excluding pandemic lockdown months, the US and UK contractions were the steepest since 2009 and 2012 respectively. In contrast, the eurozone's decline was the smallest for six months and China's decline was the mildest seen in the recent four-month period of falling production. While Japan's factory output downturn likewise moderated slightly, it remained among the sharpest witnessed over the past decade.
Chart 3: Thailand and India lead global rankings
Of the 31 economies for which S&P Global PMI data are available, only nine reported higher production volumes in December, with only marginal growth seen in two of these nine economies. Thailand and India reported stand-out performances, with both enjoying strong and accelerating growth. A strong production gain was also seen in the Philippines and - to a lesser extent - Indonesia, where, like Thailand and India, expansions were helped by the diversification of supply chains from mainland China amid the ongoing COVID-19 disruptions.
Robust growth was also recorded in Russia, reflecting the ramping up of production to meet domestic demand amid sanctions and import restrictions.
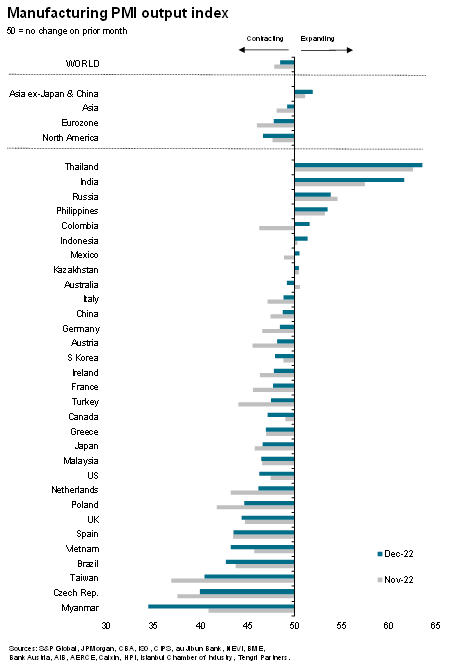
At the other end of the rankings, the steepest fall in manufacturing production was recorded in Myanmar during December, followed by the Czech Republic and Taiwan. Especially steep falls were also recorded in Brazil, Vietnam, Spain, the UK and Poland.
Chart 4: Demand downturn accelerates
One of the most concerning metrics in terms of the near-term outlook was the degree to which new orders continued to fall. New orders, changes in which reflect current demand conditions, have been falling at a notably faster pace than output in recent months, with December seeing the rate of decline accelerate further to a pace exceeding that seen at any time since the global financial crisis, barring initial pandemic months. Moreover, the spread between new orders and output widened further, to one of the largest on record, pointing to an increasing excess of operating capacity relative to current demand.
Global manufacturing order books
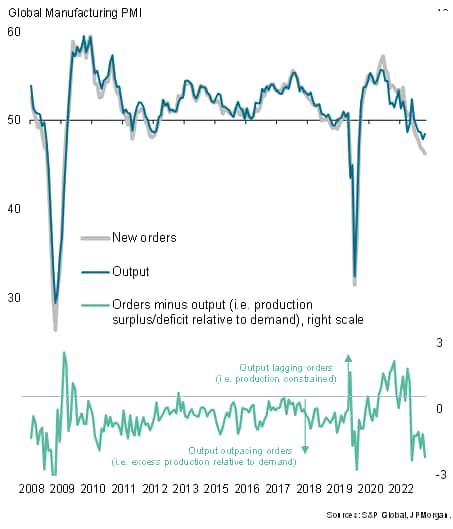
Chart 5: Employment falls amid order book downturn
The accelerating global downturn in demand for manufactured goods was also reflected in increased rate of decline of backlogs of work, which continued to fall at a rate not seen since 2009 if pandemic lockdown months are excluded. Worldwide factory employment was consequently cut, dropping slightly for a second straight month in December, as increasing numbers of firms adjusted workforce numbers lower in line with reduced capacity requirements.
Global factory employment and backlogs of work
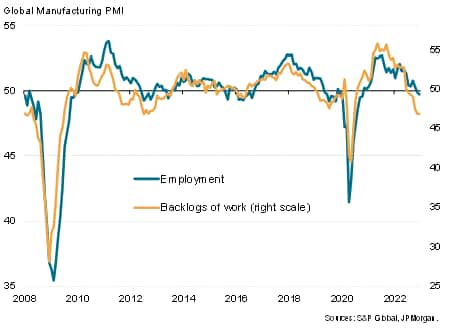
Chart 6: UK sees especially steep employment decline
An especially steep fall in manufacturing sector employment was recorded in the UK, where the cut to workforce numbers was the steepest since 2009 if early pandemic months are excluded. December also saw jobs being lost in factories in mainland China as well as notable declines being suffered in Vietnam, Poland and the Czech Republic. A slight reduction in headcounts was also seen in Asia excluding Japan and China as a whole, despite the region seeing stronger production growth.
Job creation meanwhile slowed close to stagnation in the US and Japan and weakened in the eurozone, albeit the latter outperforming in terms of overall employment growth.
PMI manufacturing employment indices
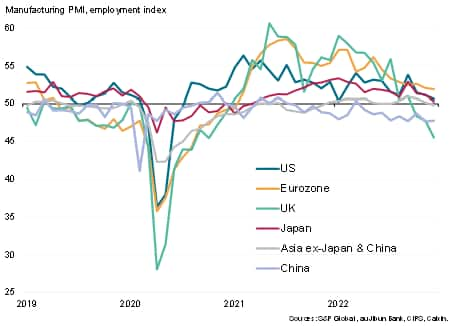
Chart 7: Input buying plunges
As well as reducing headcounts, factories also cut back on their purchasing of inputs to a degree not seen since comparable data were available in 2009, barring the initial pandemic months.
Global manufacturing inventories
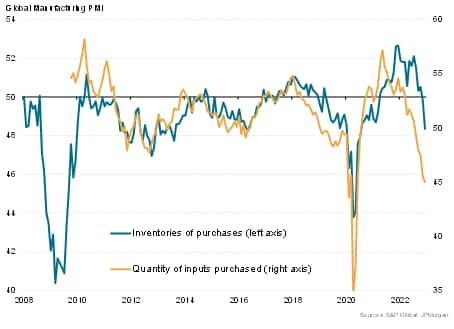
Inventories of raw materials likewise fell sharply reflecting the growing worldwide incidence of deliberate inventory reduction policies, contrasting sharply with the trend of intentional inventory accumulation seen earlier in the year and during 2021.
Chart 8: Supply improves, price pressures moderate close to long-run average
The downturn in manufacturing order books and commensurate slump in input buying took further pressure off global supply chains in December 2022. The incidence of longer supplier delivery times fell to the lowest since January 2020, just prior to the pandemic, to represent a major improvement in the global supply situation compared to the unprecedented supply scarcities reported at the start of the year and throughout 2021.
The combination of fewer supply delays and falling demand for inputs took pressure off prices. Average input prices rose in December at the slowest rate since October 2020, the rate of inflation cooling markedly compared to November to a pace only slightly above the survey's long run average.
Worldwide manufacturing output cuts due to inventory reduction policies
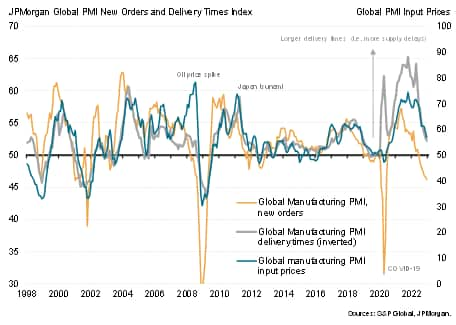
Chart 9: Factory selling prices rise at slowest rate since 2020
Slower growth of input costs fed through to weaker global factory selling price inflation in December, which saw the average rise in output prices charged by producers falling to the weakest since December 2020, the rate of increasing continuing to descend markedly from the all-time high seen back in April.
Rates of producer selling price inflation cooled in the US, eurozone, UK, Japan and the rest of Asia as a whole, with mainland China seeing a marginal fall in prices. Prices also fell in Australia, Vietnam, Taiwan and Malaysia.
PMI manufacturing output price indices
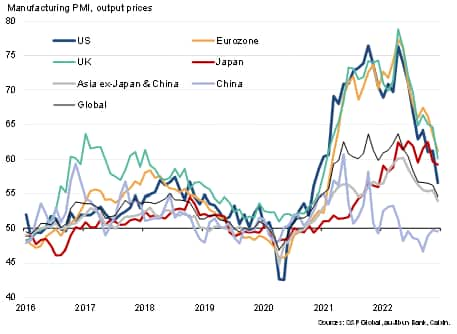
Chart 10: Future output expectations rise sharply higher
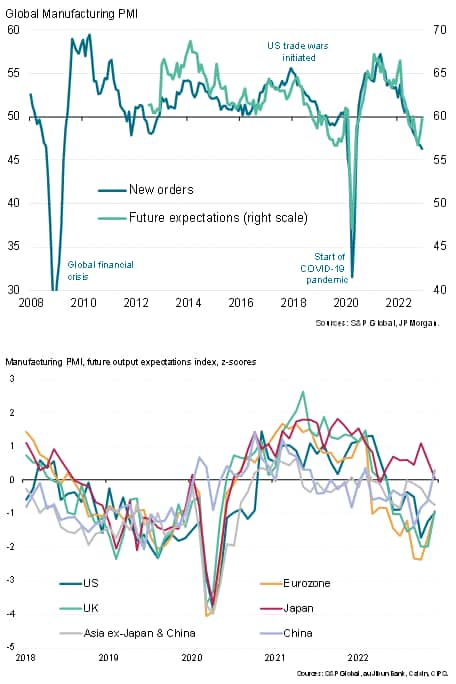
While the survey gauges of new orders, backlogs of work, input buying, inventories and employment all painted a darkening picture of current manufacturing conditions, the improvement in the supply situation was accompanied by one other glimmer of light: business expectations of output in the coming year improved in December, rising to the highest since last August. However, even with the latest improvement, the level of business optimism remained below the survey's long-run average, underscoring persistent concerns regarding the outlook for demand.
Of particular note, future output expectations recovered to a level above the long-run average in mainland China, reflecting the rolling-back of COVID-19 restrictions. Sentiment also picked up in the US and Europe, albeit remaining firmly below long-run averages. Sentiment meanwhile deteriorated in Japan and the rest of Asia as a whole, in part reflecting growing global headwinds amid a waning post-Omicron rebound.
Future output expectations
Chris Williamson, Chief Business Economist, S&P Global Market Intelligence
Tel: +44 207 260 2329
© 2023, IHS Markit Inc. All rights reserved. Reproduction in whole
or in part without permission is prohibited.
Purchasing Managers' Index™ (PMI™) data are compiled by IHS Markit for more than 40 economies worldwide. The monthly data are derived from surveys of senior executives at private sector companies, and are available only via subscription. The PMI dataset features a headline number, which indicates the overall health of an economy, and sub-indices, which provide insights into other key economic drivers such as GDP, inflation, exports, capacity utilization, employment and inventories. The PMI data are used by financial and corporate professionals to better understand where economies and markets are headed, and to uncover opportunities.
This article was published by S&P Global Market Intelligence and not by S&P Global Ratings, which is a separately managed division of S&P Global.
