Customer Logins
Obtain the data you need to make the most informed decisions by accessing our extensive portfolio of information, analytics, and expertise. Sign in to the product or service center of your choice.
Customer Logins
BLOG
Jan 19, 2021
Did the US section 301 tariffs work?
The US government began applying section 301 tariffs on Chinese imports in 2017. The disruption eventually led to the negotiation of a 'Phase One agreement' a year ago. On its anniversary, we revisit a 2019 research note, in which we analyzed in detail the lists of products targeted by the US administration in its trade war against China, showing that the initial tranches were designed so to target in priority the products for which the US economy can find substitutes; spare US consumers as much as possible; and countries like Mexico, Canada and Japan could capture the markets likely to be lost by mainland China once the dust dissipates.
Hitting China
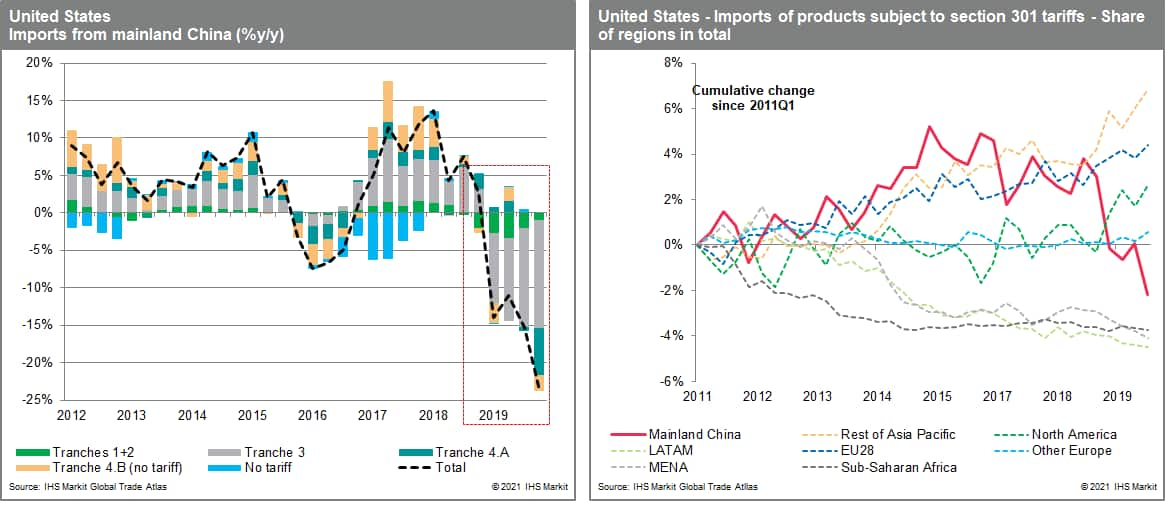
The tariffs were applied in tranches. The introduction of the tariffs was followed by a sizable reduction of US purchases from mainland China (down 25% from Q4 2018 to Q4 2019 - see chart 1), starting at the end of 2018 with the first two tranches, and amplified in 2019 as the effect of tranches three and 4.A kicked in. The loss of China's market share can be seen in chart 2. But most of China's losses in exports to the US between 2018 and 2019 (USD84bn) were partially offset by rising exports by other Asia-Pacific countries (USD25bn), Canada/Mexico (USD8bn) and the European Union (USD7bn).

Strategic trade to allies
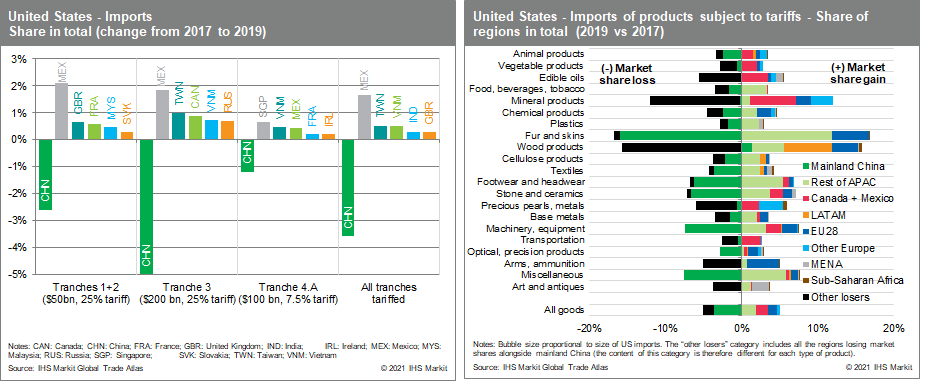
Mexico consistently captured US market share that China lost, increasing its weight in US imports by 1.6pp for the tariffed goods on average between 2017 and 2019 (chart 3). Several US allies in Europe - the UK, France, Slovakia - also benefitted on the first two tranches. Asian allies benefitted most on the third and fourth tranches - Taiwan, Singapore and, most clearly, Vietnam. The message varies by industry. While Mexico, Canada, and Europe increasingly replaced China in the minerals sector, Asian gains were concentrated in textiles, fur, plastic and chemical products (chart 4). The sizable Chinese loss in the machinery/equipment segment - which includes the strategically prized electronics business (7.4% less market share between 2017 and 2019) was captured by Canada / Mexico, Europe, and Asia, each having seen increases of exports by USD15-25bn, 2-3% of the market.

Relocation - to SE Asia
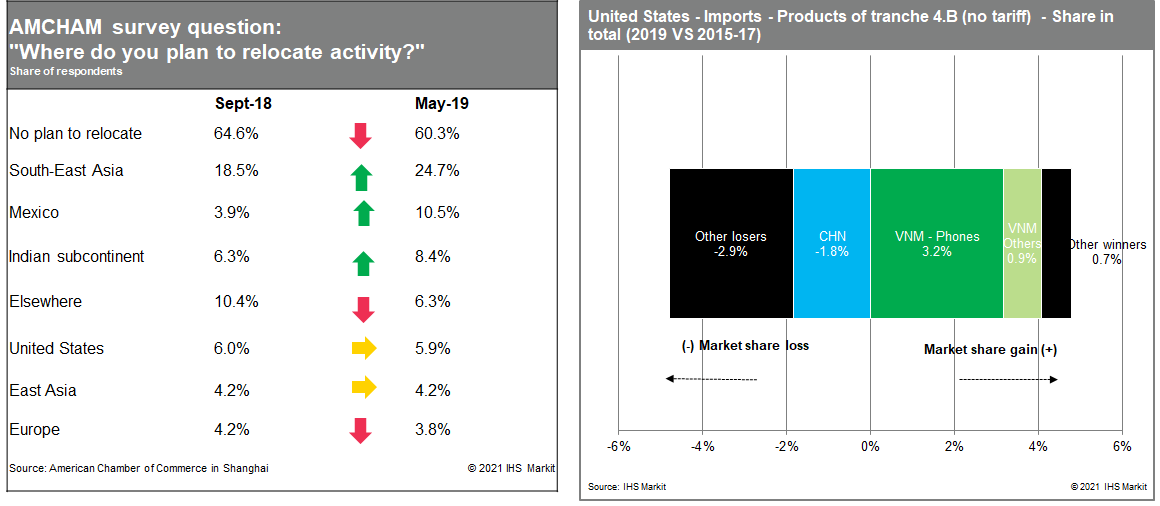
One stated aim of the tariffs, 'reshoring' manufacturing from China to the US, instead became relocation to, mostly, Southeast Asia. A May 2019 survey by the American Chamber of Commerce in China found "40.7% of respondents considered relocating manufacturing facilities outside of China"; of those, 24.7% preferred Southeast Asia, 10.5% Mexico, 3.8% Europe, and only 5.9% the US (table 1). However, 35.4% of respondents were already planning to relocate production away from China by September 2018, when only two tranches of tariffs on trade worth USD50 billion were in place. Available data on trade related to tranche 4.B (which saw no tariff increase) are also consistent with this: the retreat of Chinese market share in US imports for those products was more than offset by the gain recorded by Vietnam - over three quarters of which was attributable to the sole telephone segment (chart 5).

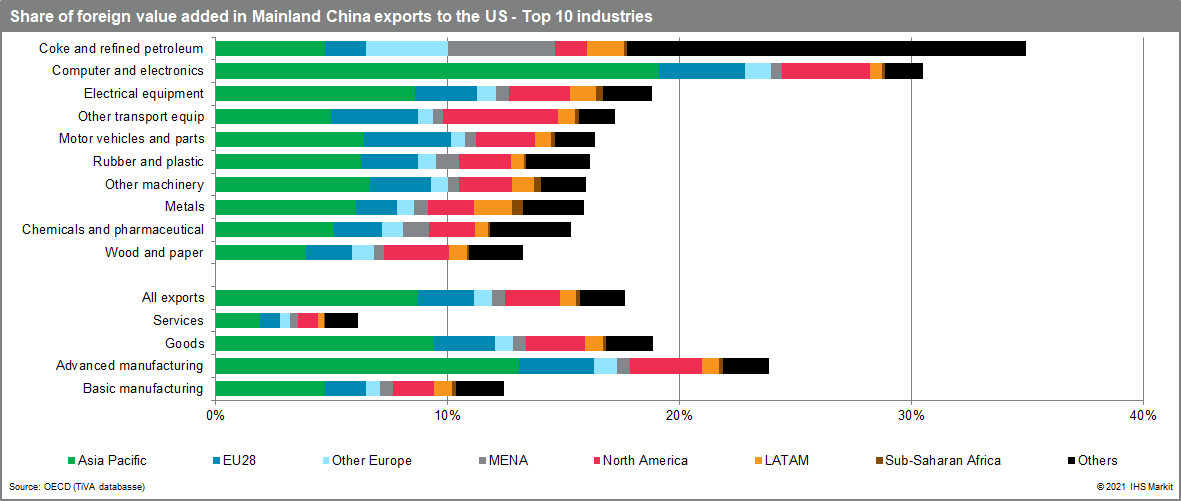
In many cases, the data for Asia should be read as a consolidation, rather than surprising new gains: for many of the exports to the US, a good portion of the upstream work is done within the region and outside of China. Chart 6 shows that in a few key sectors - electronics, transportation, electrical equipment - the share of value-added in Chinese exports attributable to its Asian neighbors is substantial - up to 30% in electronics.

Bottom line
Sun Tzu wrote "who wishes to fight must first count the cost". The section 301 tariffs met only part of the Trump administration's stated objectives: they reduced mainland China's share in the US trade. But manufacturing was not 'reshored' to the US but rather consolidated the position of Asian economies - all of them US allies - in strategically important sectors.
{"items" : [
{"name":"share","enabled":true,"desc":"<strong>Share</strong>","mobdesc":"Share","options":[ {"name":"facebook","url":"https://www.facebook.com/sharer.php?u=http%3a%2f%2fssl.ihsmarkit.com%2fmarketintelligence%2fen%2fmi%2fresearch-analysis%2fdid-us-section-301-tariffs-work.html","enabled":true},{"name":"twitter","url":"https://twitter.com/intent/tweet?url=http%3a%2f%2fssl.ihsmarkit.com%2fmarketintelligence%2fen%2fmi%2fresearch-analysis%2fdid-us-section-301-tariffs-work.html&text=Did+the+US+section+301+tariffs+work%3f+%7c+S%26P+Global+","enabled":true},{"name":"linkedin","url":"https://www.linkedin.com/sharing/share-offsite/?url=http%3a%2f%2fssl.ihsmarkit.com%2fmarketintelligence%2fen%2fmi%2fresearch-analysis%2fdid-us-section-301-tariffs-work.html","enabled":true},{"name":"email","url":"?subject=Did the US section 301 tariffs work? | S&P Global &body=http%3a%2f%2fssl.ihsmarkit.com%2fmarketintelligence%2fen%2fmi%2fresearch-analysis%2fdid-us-section-301-tariffs-work.html","enabled":true},{"name":"whatsapp","url":"https://api.whatsapp.com/send?text=Did+the+US+section+301+tariffs+work%3f+%7c+S%26P+Global+ http%3a%2f%2fssl.ihsmarkit.com%2fmarketintelligence%2fen%2fmi%2fresearch-analysis%2fdid-us-section-301-tariffs-work.html","enabled":true}]}, {"name":"rtt","enabled":true,"mobdesc":"Top"}
]}


