Customer Logins
Obtain the data you need to make the most informed decisions by accessing our extensive portfolio of information, analytics, and expertise. Sign in to the product or service center of your choice.
Customer Logins
BLOG
Aug 05, 2020
COVID-19 impact on trade in the United States of America
Using vessel port callings data combined with trade data to analyse the US response to COVID on a state level.
By the beginning of July much of the world was slowly returning to a new sense of normality following the COVID-19 pandemic; as government guidance continues to evolve surrounding COVID-19, we're now starting to see small business such as shops, restaurants and bars open again, as well as beginning to feel a growing encouragement from many governments to slowly start considering moving individuals back into their offices. The US is no exception, with many states opening since early May and Trump actively pressing for schools to re-open and business to return to normal. However, in the US this coincides with a confirmation that the number of cases in the US had risen above four million and deaths above 145,000.[i] Congress are currently seeking to extend financial aid and the number of new unemployment claims in the US has topped one million for the last 17 weeks. There is a lot of variation in the number of cases and subsequent responses between different states and the densely populated states such as New York have been highly impacted (Figure 1).
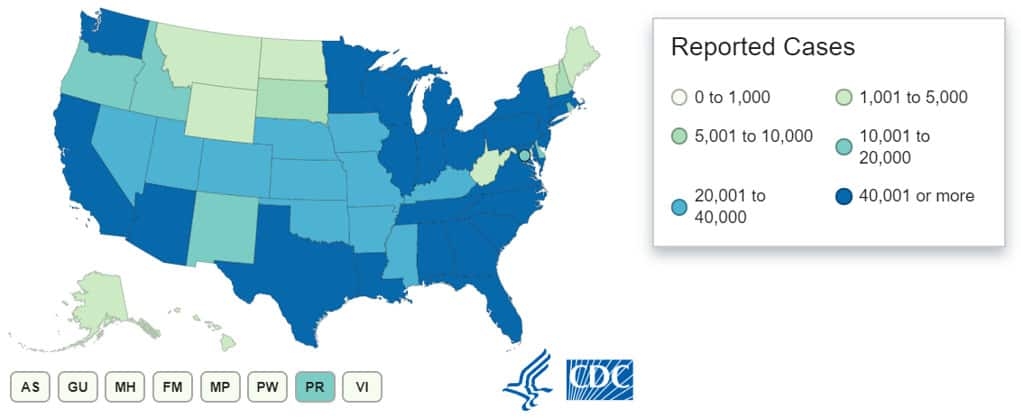
Figure 1: Coronavirus cases in the US by state. Source: Centre for Disease Control and Prevention
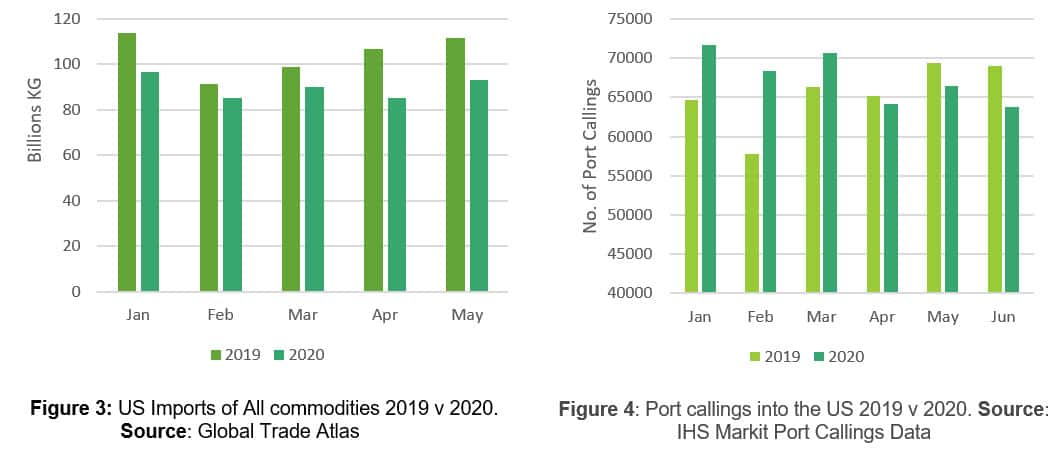
The situation in the United States makes for an interesting Case Study should one want to see the causality and influence that government measures (i.e. Lockdown) and COVID-19 reported cases effects upon both trade and shipping activity within each individual state. Using IHS Markit's Global Trade Atlas, US trade can be broken down to the port level which can be combined with our port callings data to see impacts of COVID-19 on trade and the shipping industry. As port callings data is a daily dataset it can provide insight into how trade may develop before official trade statistics are released. For the US, imports of all commodities are down in volume compared to the same period in 2019. US total imports are down 12.6% year-to-date with imports from China, Mexico and India being the hardest hit with decreases of over 20% (Figure 2). April brings the lowest volume for imports for over two years. Although there was a slight increase in May, the quantity was still well below that of previous years (Figure 3).
The number of vessels arriving into the US also shows similar trends (Figure 4). In January through to March the values were above that of 2019. This is expected given the difficult year the US had in 2019 with the US-China tensions which, combined with improvements to our AIS network and port infrastructure, leads to an increase in the observed callings in 2020 v 2019. However, in April through to June the number of calls is seen to drop down to levels below that of 2019. This all indicates COVID has had a significant impact on trade and shipping activity in the US, neither of which have returned to pre-COVID levels.

Figure 2: Percentage change in US imports year-to-date (January to May) from 2019 to 2020. Source: IHS Markit Global Trade Atlas
State Level Analysis
Given the fact that lockdowns were imposed locally as opposed to nationwide the impact on both trade and port activity could be varied. Analysis of several states has been carried out to determine how the impact may vary over states.
California
The situation in California is serious with over 400,000 cases confirmed which would put California as fifth in the rankings if it was a country.[i] California was the first place in the US to use stay-at-home orders from the end of March while much of the US was still carrying on a business as usual approach. Some of these were lifted in May when cases totalled 53,000 before an announcement of further lockdown in July [ii]. California imports are well below that of 2019 with a continual decrease from January through to April (Figure 5). There was a slight increase in trade in May, coinciding with the lifting of lockdown restrictions, however given the reinstated lockdown we may expect trade to be hit again. Most of the imports are mineral fuels which have been hard hit throughout COVID-19 with a lack of demand globally causing record lows in crude oil prices (Figure 6). For the port calls to ports in California the levels were relatively stable until April and May in which the levels were down by around 18% from March levels and dropping below the 2019 levels (Figure 7). This coincides with the introduction of lockdown and then drop in imports in April and May suggesting a likely correlation. As we anticipate new trade data to become available in august, the low level of calls in June for port callings suggest another low month in trade could be coming in June.
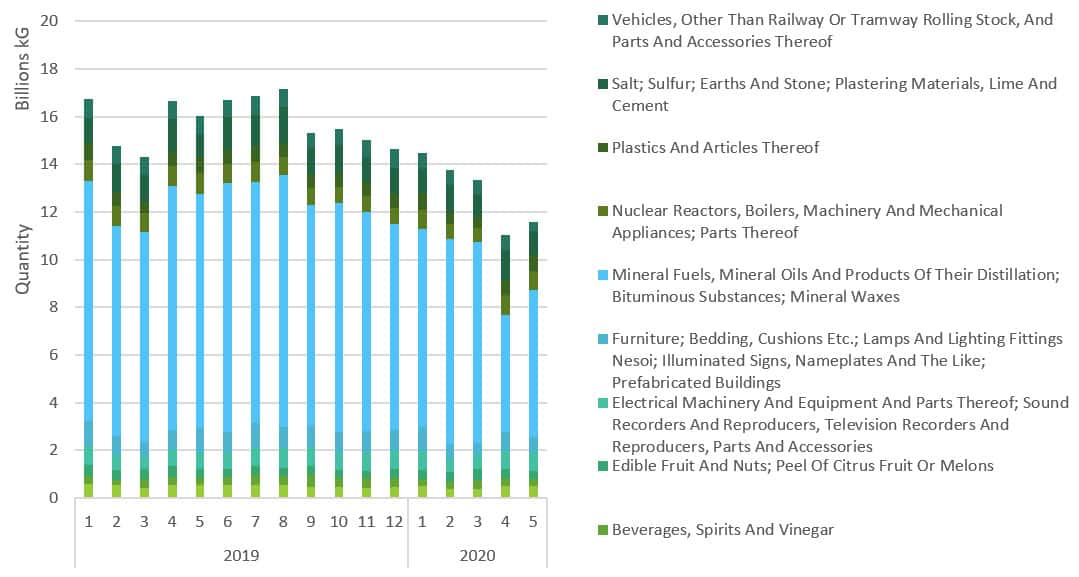
Figure 5: California imports by vessel of top 10 commodities from 2019 to present. Source:IHS Markit Global Trade Atlas
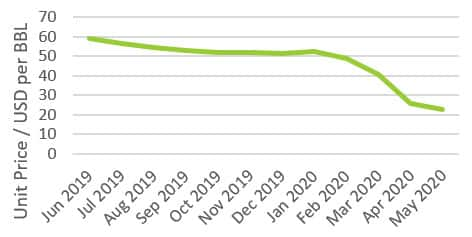
Figure 6: US unit price for imports of HS 2709 (Petroleum Oils And Oils From Bituminous Minerals, Crude) in USD per BBL Source:IHS Markit Global Trade Atlas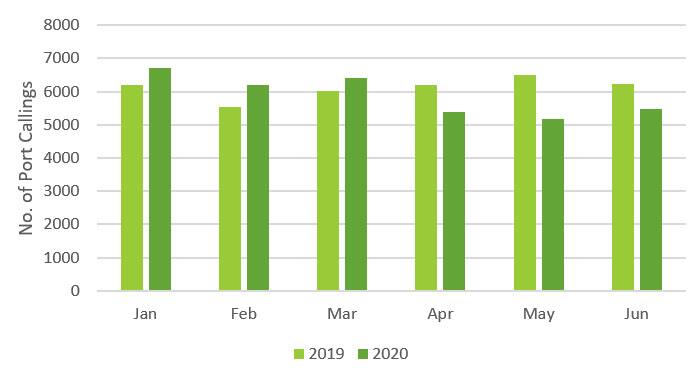
Figure 7: Number of port calls at Californian ports in 2019 v 2020 Source:IHS Markit Maritime Data
Texas
The stay-at-home order in Texas was first introduced on March 26 but began to be lifted in April, with restrictions being re-introduced at the end of June as cases began to skyrocket.[i] The trade data for Texas shows relatively stable levels in January through to March followed by a drop to a low level in April compared to the observed April levels in 2019 (Figure 8). This coincides with the April lockdown with levels jumping slightly in May when the lockdown was lifted which resulted in an increase in mineral fuels imports as activity returns to normal in May. When looking at the port callings into ports in Texas there are higher levels in 2020 compared to 2019 due to increases in port infrastructure, including new ports and terminals. The trend shows there was little variance in the port calls throughout January to April (Figure 9), which coincides with the relatively stable levels of imports from January to April. There is also an increase in callings in May, coinciding with the increase in imports seen. The low levels of callings in June suggest that there could be another drop-in reported import for the month of June from US customs. It is interesting that in a state where lockdowns have been loose compared to other states, such as California, the decline in trade and callings seems to be less noticeable. We do see a stabilization in trade and activity instead of the normal increase from January to May as seen in 2019 but there is not a large observable decrease.
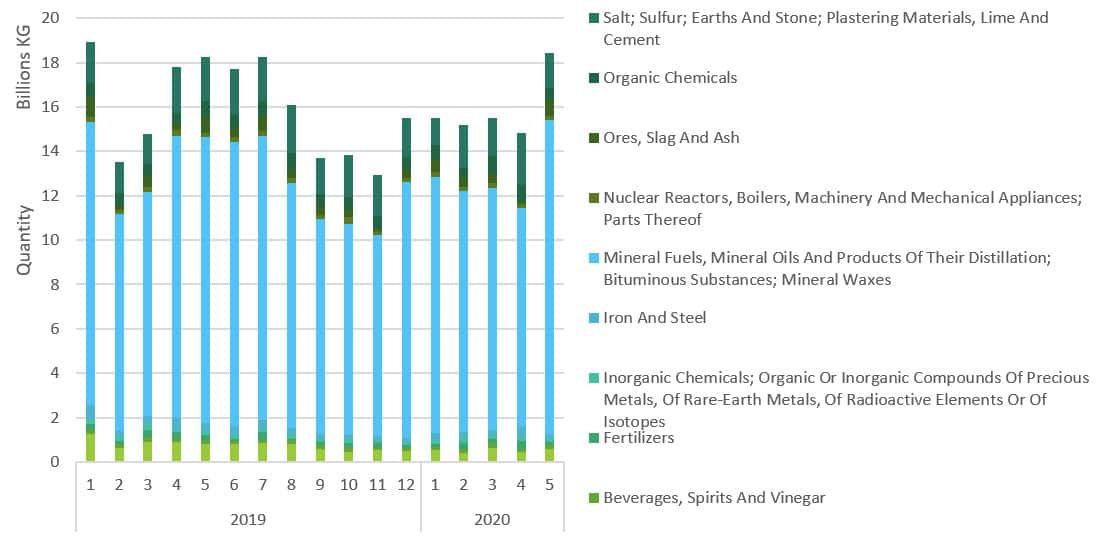
Figure 8: Texas imports by vessel of top commodities from 2019 through to 2020. Source: IHS Markit Global Trade Atlas
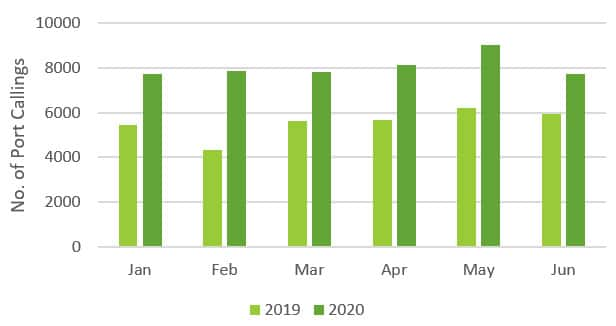
Figure 9: Texas port callings in 2019 v 2020 Source: IHS Markit Maritime Data
New York
COVID-19 hit New York early compared to other states in the US. By April 10, New York alone had more reported cases than any other country in the world [i] and by July 22, this figure continued to evolved further to 408,000.[ii] It was March 12 when the first restriction on mass gatherings were put in place and the stay at home order was signed on March 20. Restrictions were lifted on May 15 in several regions although others remained shut. [iv] However, following this strict and decisive action, unlike many states, New York case numbers seem to be staying low with no resurgence yet.
Trade in New York has been low in 2020 with a general decline from January through to April (Figure 10). That drop in trade seems to involve a drop in imports of salt. There is a big increase in imports in May mainly due to a big increase in mineral fuel imports, potentially indicating renewed demand in transportation and energy. Within the port calls there is a big drop in calls in February and March followed by increases in April and May (Figure 11). This fluctuation is unusual compared to previous years and differs in trend. It also doesn't fully correlate with the trends seen in the trade data. Compared to Texas and California the volume of imports (through waterborne trade routes) and port callings in New York are much lower. A lower volume of trade and callings makes it harder to identify trends or correlations.
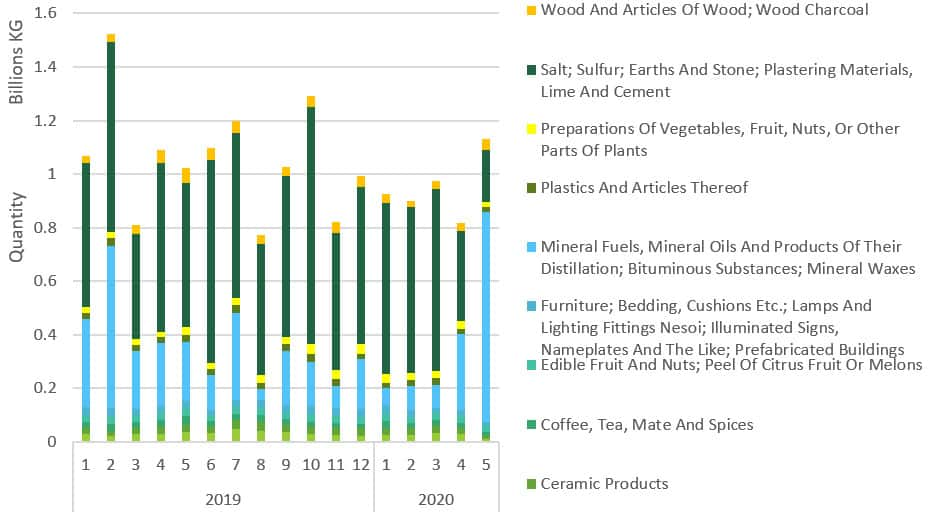
Figure 10: New York imports by vessel of top commodities from 2019 to present. Source: IHS Markit Global Trade Atlas
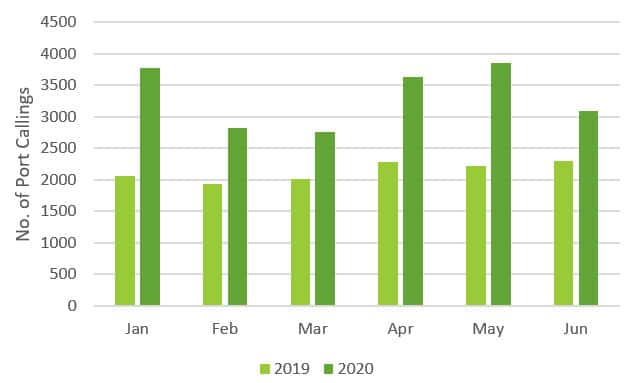
Figure 11: Port callings at New York ports in 2019 v 2020. Source: IHS Markit Maritime Data
When looking at these varying timelines and responses to COVID-19 in parallel to trade data, we start to see how the two tie together. Figure 12 displays the trade data received from our Bills of Lading by state, with triangles signifying months where a lockdown took place, and a circle represents a month where measures were lifted. The most interesting element of this diagram is what is seen occurring in Texas with the lifting of these measures early on in April which caused a surge in trade activity in the month of May with volumes reaching similar heights to those observed in 2019 (9% lower than 2019). With additional lockdowns coming into force within June it is likely that July's trade will decrease back down to previously observed lockdown levels.
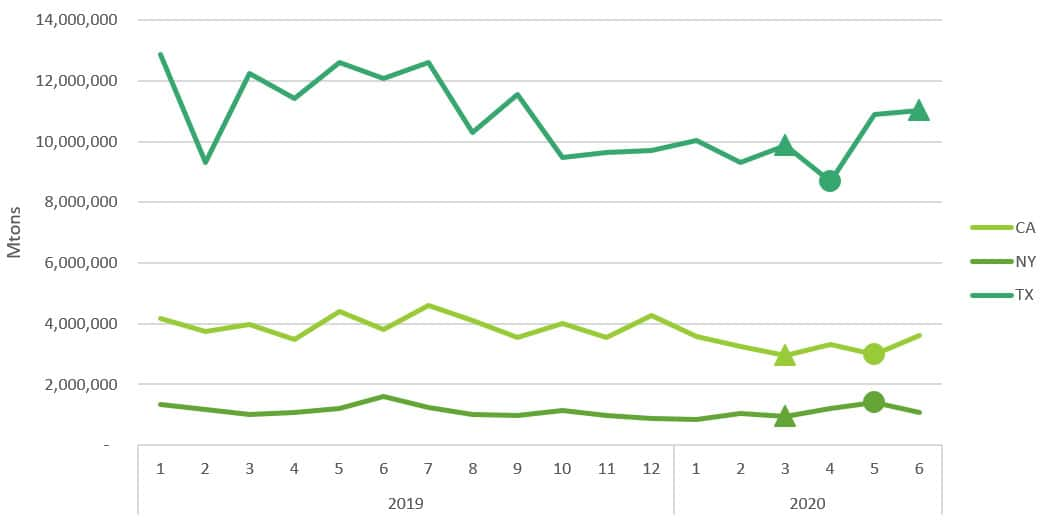
Figure 12: US imports of waterborne trade by US Company State in MTons. Source:IHS Markit - BOL
Summary
Overall, the United States has seen a significant impact from COVID-19 despite the fact not all states have adhered to strict lockdowns. On a state level the impact is varied with the states that experienced the stricter lockdowns seeing a faster slowdown in trade and port activity. The states that import larger volumes via vessel transport are easier to draw correlation and insight from. The ongoing monitoring of port callings and trade data can provide an interesting insight into the impact of coronavirus.
Subscribe to our monthly newsletter and stay up-to-date with our latest analytics
[i] https://www.cdc.gov/coronavirus/2019-ncov/cases-updates/cases-in-us.html
[iii] https://www.theguardian.com/us-news/2020/may/04/california-lockdown-business-reopen-coronavirus
[iv] https://www.nytimes.com/interactive/2020/us/states-reopen-map-coronavirus.html
[vi] https://www.statista.com/statistics/1109721/new-york-state-covid-cumulative-cases-us/
{"items" : [
{"name":"share","enabled":true,"desc":"<strong>Share</strong>","mobdesc":"Share","options":[ {"name":"facebook","url":"https://www.facebook.com/sharer.php?u=http%3a%2f%2fssl.ihsmarkit.com%2fmarketintelligence%2fen%2fmi%2fresearch-analysis%2fcovid19-impact-on-trade-in-the-united-states-of-america.html","enabled":true},{"name":"twitter","url":"https://twitter.com/intent/tweet?url=http%3a%2f%2fssl.ihsmarkit.com%2fmarketintelligence%2fen%2fmi%2fresearch-analysis%2fcovid19-impact-on-trade-in-the-united-states-of-america.html&text=COVID-19+impact+on+trade+in+the+United+States+of+America++%7c+S%26P+Global+","enabled":true},{"name":"linkedin","url":"https://www.linkedin.com/sharing/share-offsite/?url=http%3a%2f%2fssl.ihsmarkit.com%2fmarketintelligence%2fen%2fmi%2fresearch-analysis%2fcovid19-impact-on-trade-in-the-united-states-of-america.html","enabled":true},{"name":"email","url":"?subject=COVID-19 impact on trade in the United States of America | S&P Global &body=http%3a%2f%2fssl.ihsmarkit.com%2fmarketintelligence%2fen%2fmi%2fresearch-analysis%2fcovid19-impact-on-trade-in-the-united-states-of-america.html","enabled":true},{"name":"whatsapp","url":"https://api.whatsapp.com/send?text=COVID-19+impact+on+trade+in+the+United+States+of+America++%7c+S%26P+Global+ http%3a%2f%2fssl.ihsmarkit.com%2fmarketintelligence%2fen%2fmi%2fresearch-analysis%2fcovid19-impact-on-trade-in-the-united-states-of-america.html","enabled":true}]}, {"name":"rtt","enabled":true,"mobdesc":"Top"}
]}


