Customer Logins
Obtain the data you need to make the most informed decisions by accessing our extensive portfolio of information, analytics, and expertise. Sign in to the product or service center of your choice.
Customer Logins
BLOG
Apr 29, 2020
China's Exports of Pharmaceuticals, Medical Equipment and Chemicals
When looking at world exports of pharmaceutical and medical equipment/chemicals*, the total export market (by $ value), the market has increased by 44% between 2010 and 2019, with an average year-on-year increase of 4% over the ten-year period. Within this frame, China is the eleventh largest exporter when ranked by value, representing a 2.4% of total market value with a 6% year-on-year increase.
The US is the number one partner of pharmaceutical and medical equipment/chemical from China representing 18.07% of total Chinese exports. It's no surprise that market analysts are turning to trade data to assess the potential risks and disruptions to supply chains in 2020 amidst the coronavirus situation.
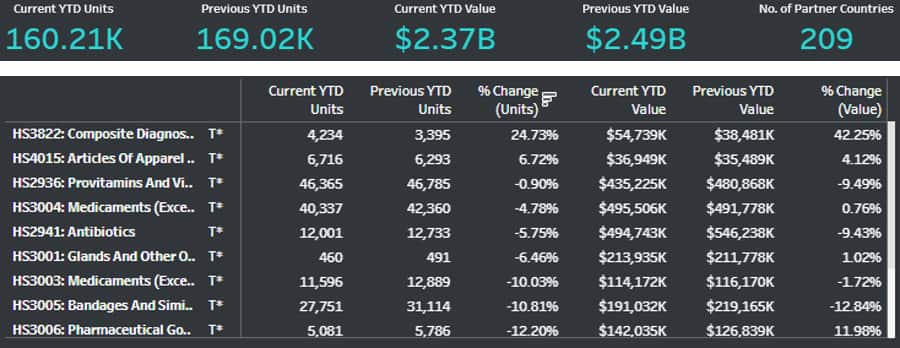
Reviewing Chinese exports data to date (January plus February), and comparing the percentage change of units and values compared to last year, we can see which commodities are being prioritised and to who amidst a 4.6% decrease in tonnage exports compared to last year. Only two subheading (HS4) commodity groups saw any positive increase in export volumes compared to last year: HS3822 Composite Diagnostic/Laboratory Reagents and HS4015 Surgical & Medical gloves made of rubber.

Figure 1: YTD (January plus February) 2020 comparison to 2019. Source: IHS Markit Global Trade Atlas
Composite Diagnostic or Laboratory Reagents (HS3822) had the highest year-on-year growth rate from 3.39K Tons / $38.48M in January plus February 2019 to 4.23K Tons / $54.74M in 2020 - representing a 24.73% volume change and 42.25 value change.
- US is the highest partner YTD ranked by volume, with a 29.13% increase in volume and 28.68% increase in value
- India is second highest partner YTD ranked by volume, with a 53.47% increase by volume and 13.86% increase in value
- Turkey is third highest partner YTD ranked by volume, with a 60.46% increase by volume and 87.46% increase in value

Figure 2: YTD (January plus February) 2020 comparison to 2019 ranked by current YTD units (Tons) by trade partner. Source: IHS Markit Global Trade Atlas
Surgical & Medical Gloves (HS4015) had the second highest year-on-year growth rate from 6.29K Tons / $35.49M in January plus February 2019 to 6.72K / $36.95M in 2020 - representing a 6.72% volume change and 4.12% value change.
- US is the highest Partner YTD ranked by volume, with a 1.71% increase in volume and an 8.32% decrease in value
- Japan is the second highest partner YTD ranked by volume, with a 194.83% increase in volume and a 188.64% increase in value
- Canada is the third highest partner YTD ranked by volume, with a 13.80% increase in volume and a 14.32% increase in value

Figure 3: YTD (January plus February) 2020 comparison to 2019 ranked by current YTD units (Tons) by trade partner. Source: IHS Markit Global trade Atlas
*This post is based on data from harmonised standard codes: HS29, HS30, HS38, HS40 and HS90
{"items" : [
{"name":"share","enabled":true,"desc":"<strong>Share</strong>","mobdesc":"Share","options":[ {"name":"facebook","url":"https://www.facebook.com/sharer.php?u=http%3a%2f%2fssl.ihsmarkit.com%2fmarketintelligence%2fen%2fmi%2fresearch-analysis%2fchinas-exports-of-pharmaceuticals-medical-equipment-chemicals.html","enabled":true},{"name":"twitter","url":"https://twitter.com/intent/tweet?url=http%3a%2f%2fssl.ihsmarkit.com%2fmarketintelligence%2fen%2fmi%2fresearch-analysis%2fchinas-exports-of-pharmaceuticals-medical-equipment-chemicals.html&text=China%27s+Exports+of+Pharmaceuticals%2c+Medical+Equipment+and+Chemicals++%7c+S%26P+Global+","enabled":true},{"name":"linkedin","url":"https://www.linkedin.com/sharing/share-offsite/?url=http%3a%2f%2fssl.ihsmarkit.com%2fmarketintelligence%2fen%2fmi%2fresearch-analysis%2fchinas-exports-of-pharmaceuticals-medical-equipment-chemicals.html","enabled":true},{"name":"email","url":"?subject=China's Exports of Pharmaceuticals, Medical Equipment and Chemicals | S&P Global &body=http%3a%2f%2fssl.ihsmarkit.com%2fmarketintelligence%2fen%2fmi%2fresearch-analysis%2fchinas-exports-of-pharmaceuticals-medical-equipment-chemicals.html","enabled":true},{"name":"whatsapp","url":"https://api.whatsapp.com/send?text=China%27s+Exports+of+Pharmaceuticals%2c+Medical+Equipment+and+Chemicals++%7c+S%26P+Global+ http%3a%2f%2fssl.ihsmarkit.com%2fmarketintelligence%2fen%2fmi%2fresearch-analysis%2fchinas-exports-of-pharmaceuticals-medical-equipment-chemicals.html","enabled":true}]}, {"name":"rtt","enabled":true,"mobdesc":"Top"}
]}


