Agri-food exports of China
Key Points:
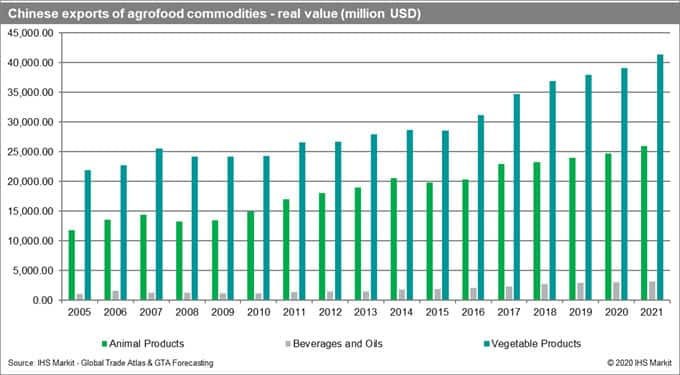
- Chinese exports of agri-food commodities amounted to USD 64.83 billion in 2019. It increased by 85% in comparison to 2005. The share of China in global agri-food exports was equal to 4.1%
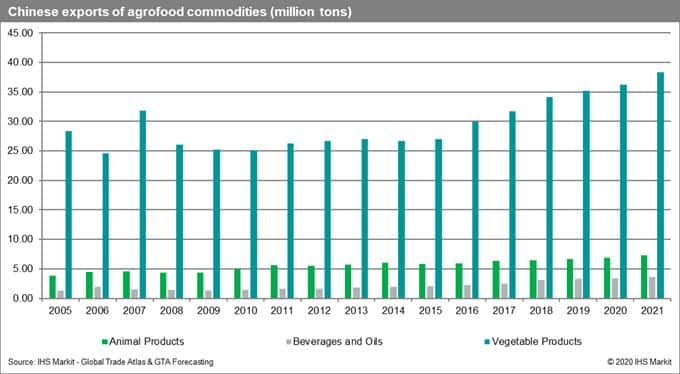
- The volume of exports amounted to 45.13 million tons and increased by 34% in comparison to 2005
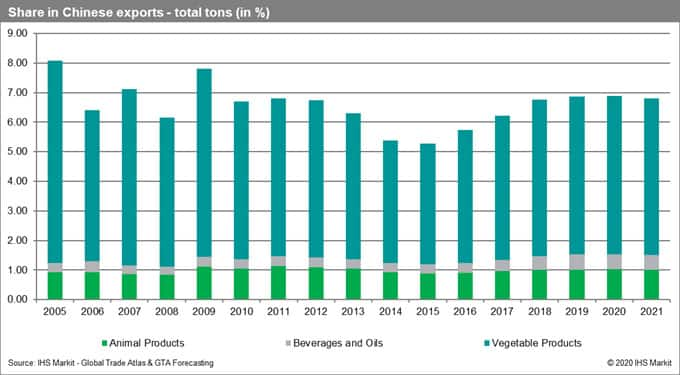
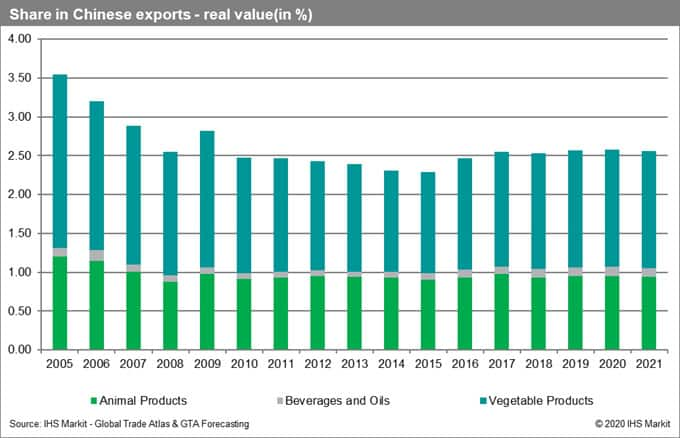
- Agri-food commodities are responsible for approx. 7% of the total volume of Chinese exports and only 2.5% of their value
- IHS Markit predicts the total volume of exports of animal products by China to increase by 3.6% in 2020 and 5.2% in 2021. The volume of exports of beverages and oils is forecasted to increase by 4.3% in 2020 and 4.4% in 2021. For vegetables, the volume is predicted to increase by 3.0% in 2020 and 5.8% in 2021
- Top destinations for Chinese exports of animal products (real value in USD) include Japan, the United States, Hong Kong, South Korea, and Germany
- Top destinations for Chinese exports of beverages and oils are located mostly in East Asia and include Hong Kong SAR, North Korea, Malaysia & South Korea. The fifth in the ranking is the Netherlands
- Top destinations for Chinese exports of vegetables products (the most important group in the terms of real value) include Japan, Vietnam, Hong Kong SAR, United States, South Korea
Background information
China with the population of 1,439,323,776 is the biggest country of the world with a total share of 18.5%. Due to its size China is the second largest importer of agri-food products after the US. Its imports amounted to USD 142 billion in 2019 which was responsible for 6.4% of global imports. At the same time China is one of the main exporters of agri-food products. In 2019 China (mainland) was the sixth largest exporter of agri-food commodities after US, Brazil, the Netherlands, Germany and France. Its share in the global exports of agri-food commodities was equal to 4.1%. In the present article we will focus on the Chinese exports.
Total volume and real value by commodity group
Volume of trade of Chinese agri-food commodities is steadily increasing. The total exports of animal products reached 6.69 million tons in 2019. It was 3.30 million tons for beverages and oils and 35.1 million tons for vegetable products. In terms of shares in total volume of exports it equaled 14.8, 7.3 and 77.9% respectively. In total the volume reached 45.13 million tons in 2019. For comparison it was equal to 33.58 million tons in 2005 and 31.43 million tons in 2010. It represents an increase by roughly one third.
In value terms (real value in USD) the exports of animal products amounted to USD 23.971 billion in 2019, USD 2.916 billion for beverages and oils and USD 37.95 billion for vegetable products. The total value of agri-food exports by China equaled to USD 64.83 billion. It increased by 85% in comparison in 2005.
Growth rates by commodity group
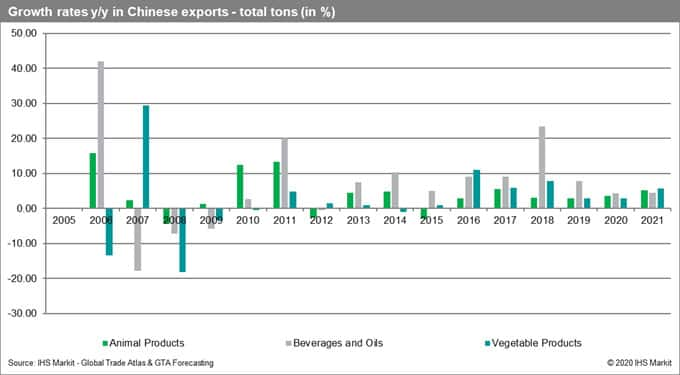
The CAGR for the volume of animal products in Chinese exports over the period 2005-2019 was equal to 4.05 %. It was higher for beverages and oils - 6.68% and lower for vegetable products - 1.53%. On average the volume increased by 2.13%.
IHS Markit predicts the total volume of exports of animal products by China to increase by 3.6% in 2020 and 5.2% in 2021. The volume of exports of beverages and oils is forecasted to increase by 4.3% in 2020 and 4.4% in 2021. For vegetables the volume is predicted to increase by 3.0% in 2020 and 5.8% in 2021.
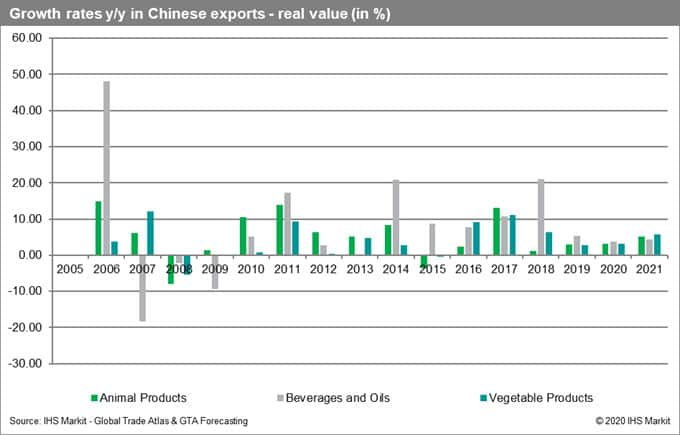
The CAGR for the real value of animal products in Chinese exports over the period 2005-2019 was equal to 5.2%. It was higher for beverages and oils 7.4 % and lower for vegetable products 4.0%. On average the real value of Chinese agri-food exports increased by 2.13%. It is worth to note that the average growth rates in exports are higher in values than in volume.
IHS Markit predicts the real value of Chinese exports of animal products to increase by 3.6% in 2020 and 5.2% in 2021. The real value of Chinese exports of beverages is predicted to increase by 4.3% in 2020 and 4.4% in 2021 and of the vegetables to increase by 3.0% in 2020 and 5.8% in 2021 respectively. It is difficult to assess the overall impact of the recent outbreak of COVID-19. This will depend on its duration (whether it is going to extend well into Q2 of 2020) and overall magnitude. The impact will, of course, is adverse.
Share of agri-food products in Chinese exports
Agri-food commodities are responsible for approx. 7% of the total volume of Chinese exports and only 2.5% of their value. In comparison to 2005, the shares have fallen for both the volume and the real value. In the next two years, the share of the commodities is the Chinses exports are predicted not to change significantly.
Top commodities by product group in 2019
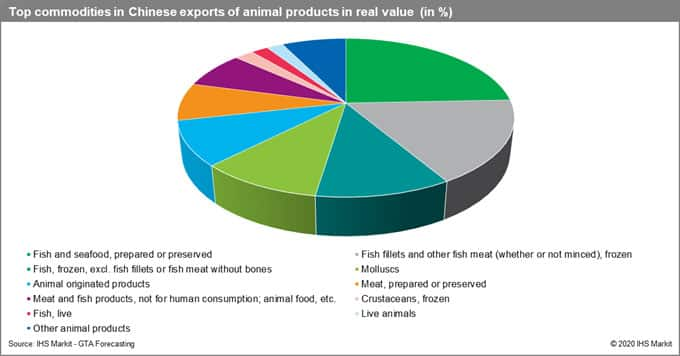
The Chinese exports of animal products are clearly dominated by marine and aquatic products. The products with the highest shares include fish and seafood, prepared or preserved (24.4 %), frozen fish fillets and other fish meat (17.1%), frozen fish (11.0%) and mollusks (10.0%).
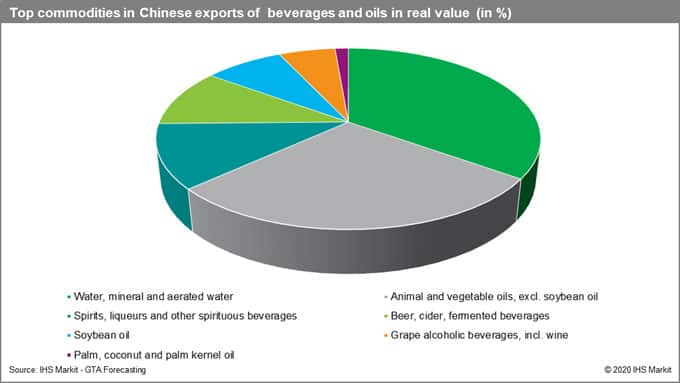
In exports of beverages and oils, we can observe several dominant product groups. The most important ones are water, mineral and aerated water (34.9%) and animal and vegetable oils, excl. soybean oil (28.4%). These are followed by spirits, liqueurs and other spirituous beverages (11.5%), beer, cider, fermented beverages (10.3%) and lastly soybean oil (8.0%).
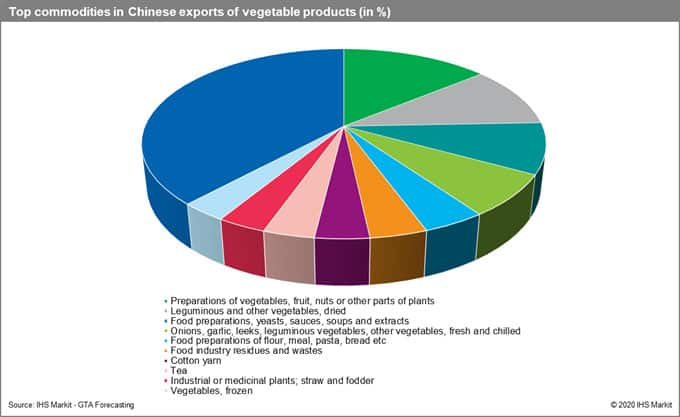
In the group of vegetable commodities, the top product groups include preparations of vegetables, fruit, nuts or other parts of plants (14.0%), dried leguminous and other vegetables (10.4%) and food preparations, yeasts, sauces, soups and extracts (8.6%).
Top destinations for Chinese exports of animal products (real value in USD) include Japan, the United States, Hong Kong, South Korea, and Germany. These top five countries had a cumulated share of 62% with Japan alone responsible for one-fifth of total export value (CR5 - concentration ratio - cumulated share of top five destinations).
Top destinations for Chinese exports of beverages and oils are located mostly in East Asia and include Hong Kong SAR, North Korea, Malaysia & South Korea. The fifth in the ranking is the Netherlands. The top five destinations had a share of 66.5% - even higher than in the case of animal products.
Top destinations for Chinese exports of vegetable products (the most important group in terms of real value) include Japan, Vietnam, Hong Kong SAR, United States, South Korea. The CR5, in this case, is significantly lower and reaches 44.8%.
This column is based on data from IHS Markit GTA Forecasting and other resources from IHS Markit if not stated otherwise. 2020 and 2021 values are predictions.
Due to missing data and lack of forecasts the following commodities have been excluded from the analysis: dairy produce; birds' eggs; natural honey; edible products of animal origin, n.e.s.; edible offal of bovine animals, swine, sheep, goats, horses, etc., fresh or chilled; fish fillets and other fish meat (whether or not minced), n.e.s., fresh, chilled or frozen and beverages, spirits and vinegar, n.e.s.