The North American Power Analytics product provides extensive sensitivity analysis data relating to natural gas price and long-term renewables penetration on a visually dynamic and interactive platform, supplementing the S&P Global comprehensive power outlook out to 2050. Customize your workflow and gain a deep understanding of the North American power market to better assess business opportunities and gain a competitive edge.
Customer Logins
Obtain the data you need to make the most informed decisions by accessing our extensive portfolio of information, analytics, and expertise. Sign in to the product or service center of your choice.
Customer LoginsNorth American Power Analytics
What Key Questions Does This Product Address?
Renewable energy project developers:
- What are the merchant tail risks for my project development pipeline?
- How will varying levels of battery penetration interact with merchant tail revenues?
Financial sector:
- How can I easily view the range of risks during deal support?
- How will an asset’s position on the merit order curve evolve over time?
- How can I get a quick view of energy margins in the comprehensive power outlook to 2050?
Global energy companies:
- What are the risks inherent in the electricity markets?
- How can I get sensitivity analysis visualizations to study new power markets at a glance?
Independent power producers:
- What are the operational risks to my portfolio?
- How will my position on the merit order curve change with higher renewables penetration?
Who Benefits From This Product?
- Renewable energy project developers
- Financial sector
- Global energy companies
- Independent power producers
How Do Clients Use This Product?
- Senior analyst at a private equity firm:
Scrutinizes the merchant tail and long-term operational and financial risks for several acquisition targets, across different markets and asset classes.
- Strategic planner at a global energy company:
Delves deeply into North American power markets, examining how the merit order curve, capacity factor, captured price and energy margins change over time within specific markets to study potential investment diversification opportunities.
- Origination manager at a renewable energy project development company:
Examines the impact of increasing battery penetration on existing project and pipeline portfolio.
What Makes Us Rise Above the Competition?
- This product is analytics-rich. It features 1200 renewable energy penetration simulations to portray a granular level of risk.
- We offer unrivaled combination of depth and breadth. We include a more in-depth look at both our comprehensive power outlook and sensitivities across a broad range of possible outcomes.
- The expertise of our wide-ranging team of experts is unparalleled. Built out by the S&P Global power team, this offering is backed by deep knowledge and expertise in technology, policy, and regional power markets.
Renewable Energy Penetration Sensitivity Module
Natural Gas Price Sensitivity Module
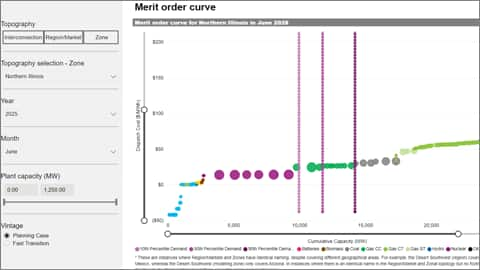
Merit Order Curve Module
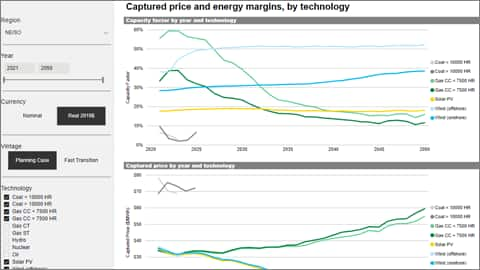
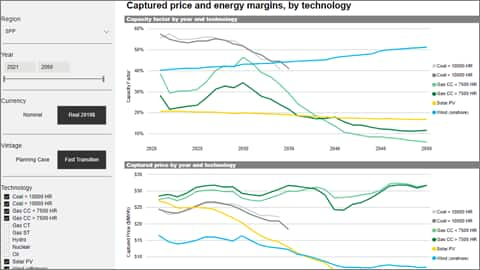
Forecasting Analytics Module
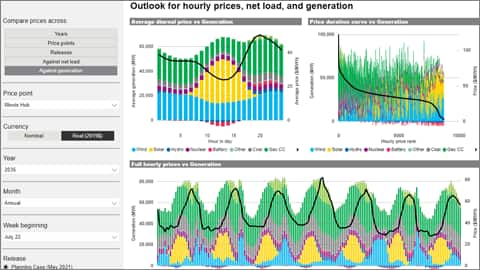
Hourly Data Module
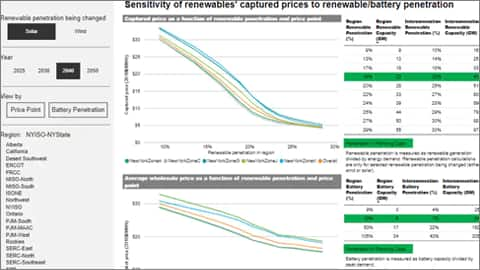
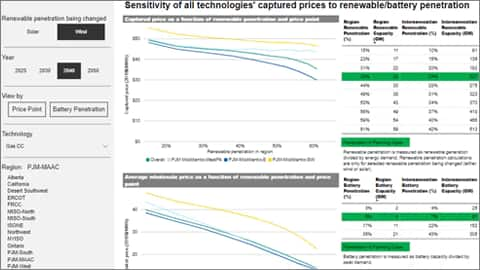
Provides visualizations of key price and operational data, in response to increasing levels of renewable energy penetration:
- All North American markets/regions; multiple price points
- Captured prices for renewables and thermal generators, all-hours market prices, renewables curtailments (zonal)
- Diurnal operating patterns of batteries and other technologies
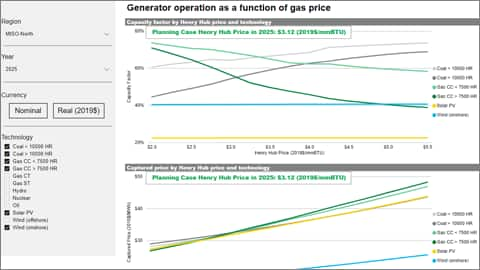
See the sensitivity of each generation technology’s capacity factor, captured price, and energy margin to the natural gas price; presented for each year and market/region.
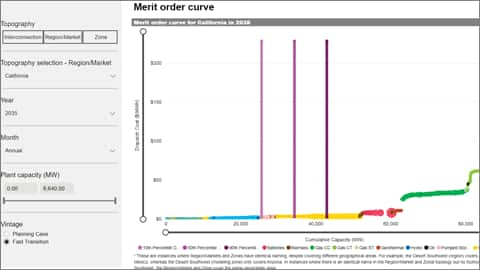
Features generation supply curves by month-year or year for each market/region, depicting each technology type along with 10th, 50th, and 90th percentile market demand levels.
Features capacity factor, captured price and energy margin by technology, year, and region for the S&P Global forecasting base case for the North American power markets.
Detailed visualizations of hourly prices, net loads, and generation by technology for the S&P Global forecasting base case and a number of sensitivity cases. Contains the average diurnal price, price duration curve, and full hourly prices for any price point and time period. Compare hourly prices across years, price points, cases, or compare hourly prices against net load and generation by technology.
Comparison of hourly prices across different years in Dominion in S&P Global's comprehensive power outlook
Events
A new visualization of power market evolution: Examining the impact of renewables and battery penetration on North American power markets with data-driven analytics (Americas/EMEA)
November 17 2020 | North America We introduce our newest data analytics solution, North American Power Analytics (NAPA), a powerful interactive tool built around hundreds of power...
{"slidesToScroll": 1,"dots": true,"arrows": true,"autoplay":false}
Explore
RELATED INDUSTRIES & TOPICS
{"items" : [
{"name":"facts","url":"","enabled":false,"desc":"","alt":"","mobdesc":"PDF","mobmsg":""},{"name":"login","url":"","enabled":false,"desc":"Product Login for existing customers","alt":"Login","large":true,"mobdesc":"Login","mobmsg":"Product Login for existing customers"},{"name":"sales","override":"","number":"[num]","enabled":true,"desc":"Call Sales [num]","proddesc":"[num]","alt":"Call Sales</br>[num]","mobdesc":"Sales","mobmsg":"Call Sales: [num]"}, {"name":"share","enabled":true,"desc":"<strong>Share</strong>","mobdesc":"Share","options":[ {"name":"facebook","url":"https://www.facebook.com/sharer.php?u=http%3a%2f%2fssl.ihsmarkit.com%2fcommodityinsights%2fen%2fci%2fproducts%2fnorth-america-power-analytics.html","enabled":true},{"name":"twitter","url":"https://twitter.com/intent/tweet?url=http%3a%2f%2fssl.ihsmarkit.com%2fcommodityinsights%2fen%2fci%2fproducts%2fnorth-america-power-analytics.html&text=North+American+Power+Analytics+%7c+S%26P+Global","enabled":true},{"name":"linkedin","url":"https://www.linkedin.com/sharing/share-offsite/?url=http%3a%2f%2fssl.ihsmarkit.com%2fcommodityinsights%2fen%2fci%2fproducts%2fnorth-america-power-analytics.html","enabled":true},{"name":"email","url":"?subject=North American Power Analytics | S&P Global&body=http%3a%2f%2fssl.ihsmarkit.com%2fcommodityinsights%2fen%2fci%2fproducts%2fnorth-america-power-analytics.html","enabled":true},{"name":"whatsapp","url":"https://api.whatsapp.com/send?text=North+American+Power+Analytics+%7c+S%26P+Global http%3a%2f%2fssl.ihsmarkit.com%2fcommodityinsights%2fen%2fci%2fproducts%2fnorth-america-power-analytics.html","enabled":true}]}, {"name":"rtt","enabled":true,"mobdesc":"Top"}
]}


