Customer Logins
Obtain the data you need to make the most informed decisions by accessing our extensive portfolio of information, analytics, and expertise. Sign in to the product or service center of your choice.
Customer Logins
BLOG
Dec 07, 2022
Trade Route Question: Connecting or Direct Shipping?
Introduction
In international maritime shipping, direct route is not always available for many shippers. While non-stop from origination to destination will always be the preferred, simplest and most straightforward service favoured by large shippers, transit and transshipment are common practices in containerised shipping, especially in long-haul journey and with cargo from smaller countries.
Southeast Asia is now in a period of fast-paced export growth and increasing their share in total U.S. import. However, from a traffic perspective, volume directly shipping out of origination ports sailing Transpacific ship routes is not moving in the same linear pattern, as observed through transactional trade data from S&P Global Market Intelligence's Global Trade Analytics Suite (GTAS).
In this article, we utilise trade and maritime capabilities by Global Trade Analytics Suite, Container Port Performance and Maritime Intelligence Risk Suite to analyse the international shipping transshipment rates. Harnessing a month's transactional trade data on SE Asia to U.S. as a sample, we examined the routes of these shipments and the possible economic justification of these patterns.
For transport service providers such as ocean carriers, opening a liner shipping service and determining the ports to call is not a single-factor decision. Understanding trade pattern and outlook demand from each addressable cargo catchment market, while maximising cost-effectiveness, are among a series of factors to consider in vessel deployment.
On the other side, for port or terminal operators, understanding the global trade pattern dynamics and inherent transport network movement would allow them to proactively cater to the needs of their prospects, as well as benchmark their competitiveness in terms of efficiency and ease of doing business against their regional peers, obviously critical to sustainable growth and long-term strategic planning.
Direct and Transit / Transshipment
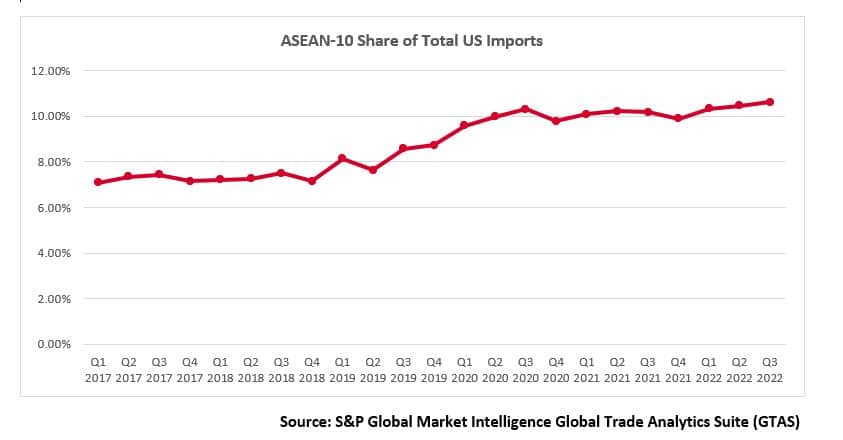
Southeast Asia is evolving as an important sourcing region to the U.S. and other economies. With macro trade data by Global Trade Analytics Suite (GTAS), U.S. imports from ASEAN-10 increased 22.54% during Jan - Sep 2022 comparing to the same period last year. The share in total U.S. imports from ASEAN-10 kept rising in recently years and exceeded 10% for the first time in Q3 2020, with the momentum sustained. In the first three quarters of 2022, the percentage of imports from ASEAN-10 remained around 10.5%.
For seaborne containerised trade, import volume (in 20-foot equivalent units, or TEUs) from SE Asia also significantly increased in the past decade, especially in recent years since 2018. A roaring pattern is notable with CAGR 14.26% from 2017 - 2022, a much faster pace compared to the prior five years (CAGR 8.77%). According to the latest forecast by GTAS Forecasting, the estimated growth rate toward 2030 with annual average increase by 4.12% and by 2030 total seaborne container trade imported by U.S. from ASEAN-10 countries is expected to exceed 6.68 million TEU.
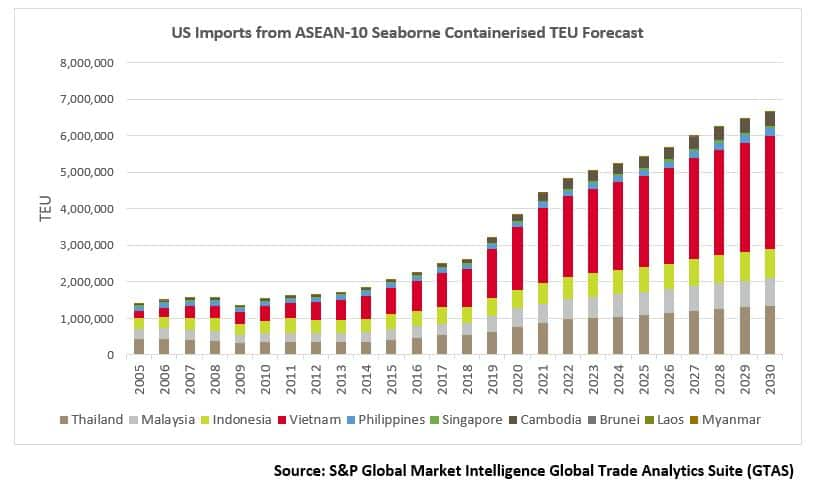
This has also brought steady eastbound Transpacific containerised trade shipping. However, when analysing U.S. waterborne import trade data, the volumes reported from ASEAN-10 origin countries are much less than the actual U.S. import. As we see from the above chart, annual containerised trade shall be approximately over 4 million TEU in 2021; however, aggregating from transaction data by PIERS with ASEAN-10 members as the 'initial country', the overall volume is less than 0.14 million TEU.

This apparent 'mismatch' results from a typical practice in international shipping: transit and transshipment, by which the shipment departing from certain regions are not directly arriving in the destination country, but rather passing through one or more transit locations. In the transshipment case, it also involves discharge and re-loading to another vessel at the transshipment port, similar to the concept of 'connecting flights'.
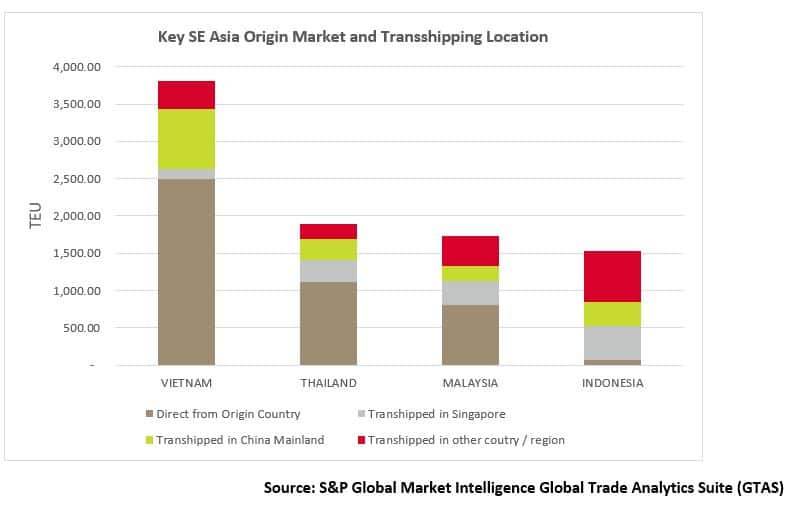
Taking the latest monthly U.S. waterborne transactional data (Sep 2022) as a data sample, it is observed that shipments originating from ASEAN-10 countries involve a varied level of transshipment percentage, ranging from 34% (in the case of Vietnam) to 98% (in the case of Philippines and Cambodia), when measured by TEU volume. The top import origins in ASEAN are Vietnam, Thailand, Malaysia and Indonesia, respectively with 3,807 TEU, 1,893 TEU, 1,728 TEU and 1,531 TEU imported into U.S. in September 2022. Among all these, the transshipment rate (as identified to have a 3rd country as the 'initial country' before arriving in the U.S.) is estimated at 34% (Vietnam), 41% (Thailand), 54% (Malaysia) and 96% (Indonesia) respectively.
Major Transshipment Hubs for Southeast Asian shipments
A detailed look at those transshipped shipments may identify those major container ports that are used for cargo from Southeast Asia and relayed to the U.S. Focusing on the top exporters (i.e. Vietnam, Thailand, Malaysia and Indonesia), a list for large container ports are identified to be the most popular places for the cargo to transit prior arriving in the U.S.
Out of 1,307 TEU transshipments originated from Vietnam, 217 TEU were transited through Yantian, followed by Kaohsiung and Singapore with 207 TEU, representing 16.6%, 15.8% and 9.5%, respectively.
Rationale for Transshipment Hub Choice
Journey time Comparison
The processing efficiency is important to cargo operations, especially when the full journey involves intermediary locations, i.e. transshipment or transit. An inevitable question to be asked is, would transshipment always take longer to arrive at the destination, when compared to direct shipment?
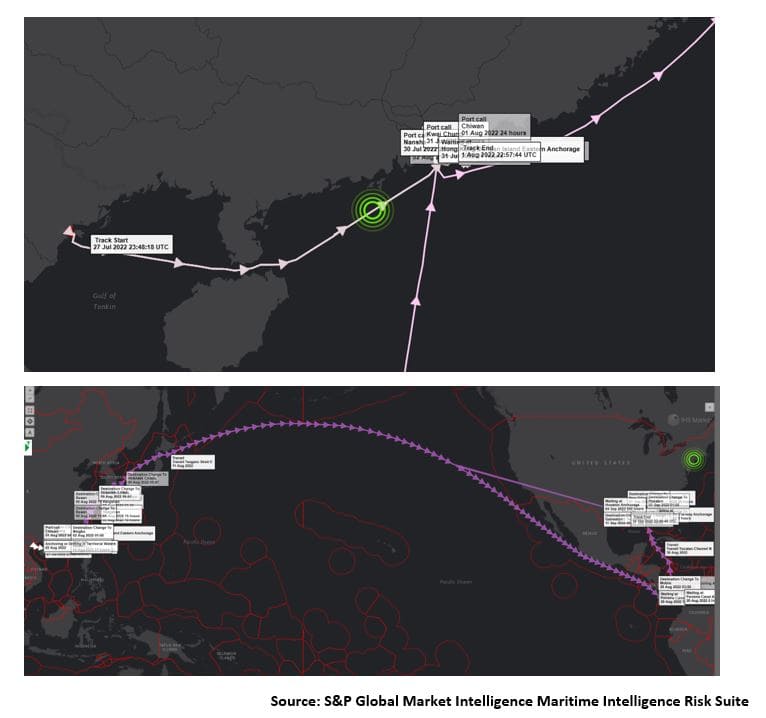
Tracking a shipment loaded from Vietnam and transshipped at Shekou Port, we can view the logistics sequentially:
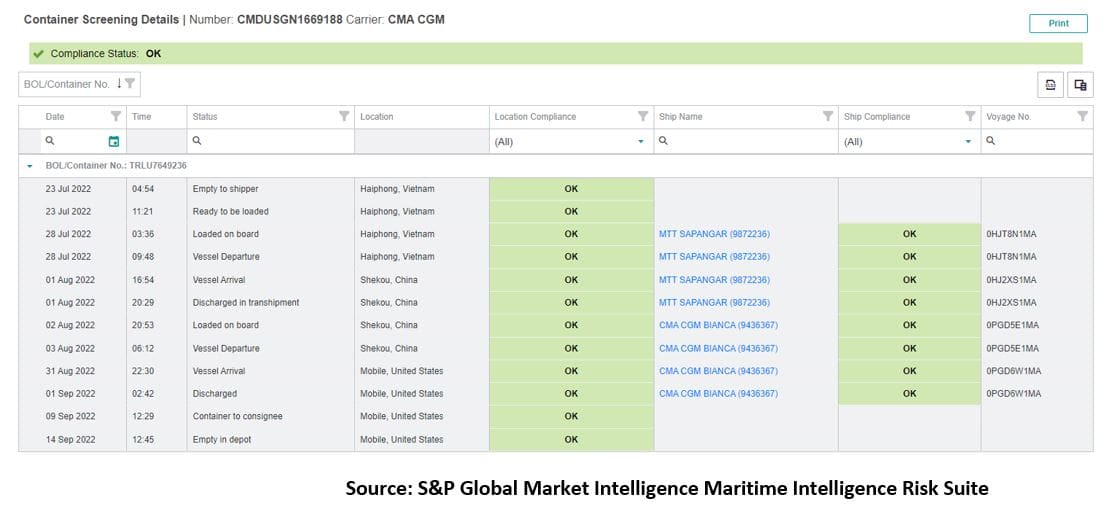
- Loaded at original port (Haiphong) on July 28
- Transit at Shekou (August 1-2) from vessel MTT SAPANGAR to CMA CGM BIANCA
- Depart from Shekou on Aug 3. Arrival in Mobile, U.S., on August 31, discharged on September 1
- Total time in transit (from loading to discharge): 34 days
Two vessels are used in relaying of shipping i.e. MTT SAPANGAR (IMO 9872236) and CMA CGM BIANCA (IMO 9436367). MTT SAPANGAR is a regional feeder, with capacity of 1,800 TEU and service speed at 19 knots; CMA CGM BIANCA is Post-Panamax containership with a service speed of 25.8 knots and capacity of 8,533 TEU.
The voyage shows the relay of the two ships when tracking via the AIS map of S&P Global Market Intelligence's Maritime Intelligence Risk Suite. The timestamps also tell that the first leg vessel MTT SPANGAR arrived at Shekou (Chiwan) on August 1 while CMA CGM BIANCA completed its port call at Mawan on August 2 - meaning within one day the container was discharged from the former vessel, in-port moving from Chiwan to Mawan (both part of Shenzhen), and loaded to the latter vessel. This requires a smooth operation and is supported by the Great Bay policies in facilitating international transit (Source: https://www.mot.gov.cn/jiaotongyaowen/202207/t20220701_3660347.html).
In comparison, below is the track of a shipment directly departed from Vietnam and arriving in U.S. without stopovers:
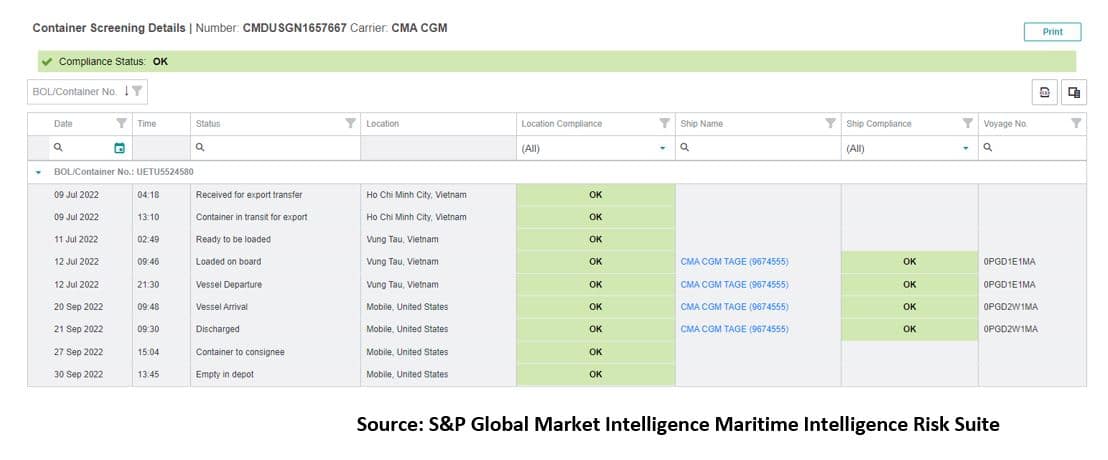
- Container loaded on board on July 12, departure on the same day
- Arriving in U.S. on September 20, discharged on September 21
- Total time in transit (loading to discharge): 71 days
The vessel CMA CGM TAGE (IMO 9674555) is a Post-Panamax containership with capacity of 9,365 TEU, service speed 22 knots.
Using Voyage Calculator we could estimate and compare the pure voyage time (theoretically) by inputting the speed and departure/arrival ports assuming a certain service speed:
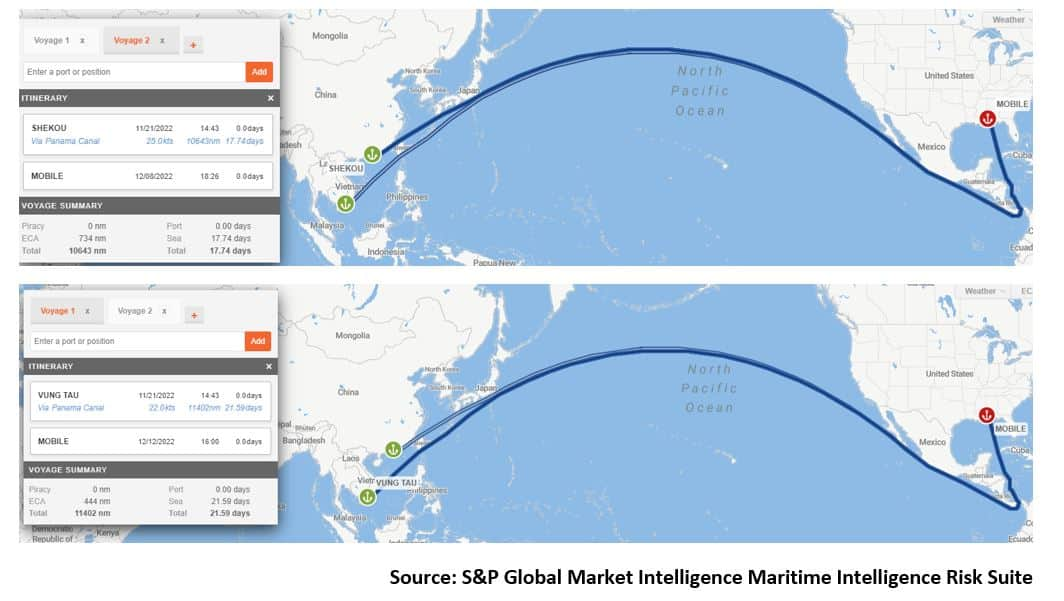
Notably, the total journey time is also impacted by the port time. Highly efficient modern container port operations make it possible to make up for lost time and at least partially mitigate the multiple callings compared to direct shipping.
By examining container port performance via S&P Global Market Intelligence's Port Performance Program, we may derive a clearer picture on why the transshipment is viable from an operational efficiency perspective. For all vessel sizes, the below table lists out average port hours in August - September 2022 for Southeast Asia and China Ports. Singapore tops the efficiency ranking for larger port calls (over 6,000 moves per call); followed by Yangshan and Ningbo, both located on the East Coast of China, and Yangshan are ranking high across all call size segments.
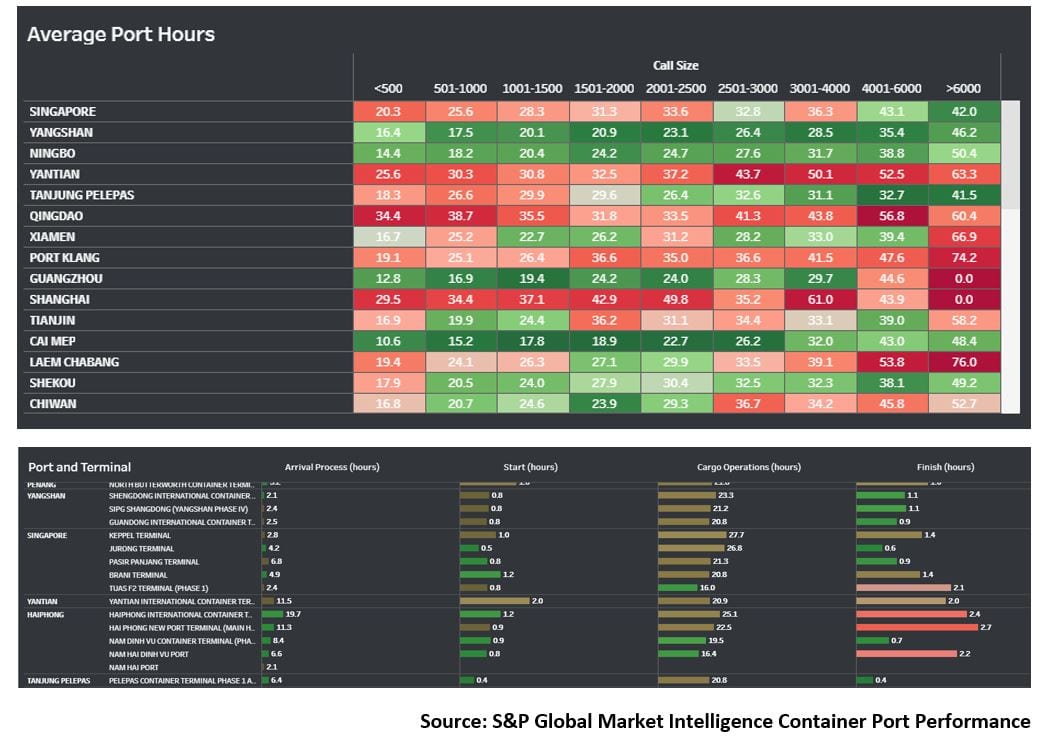
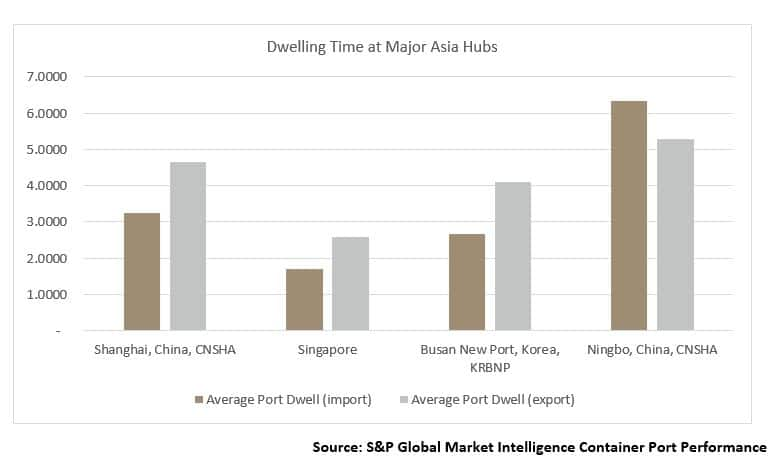
Port operation, together with the lead time for border processing and other formalities, will determine dwelling time. When it comes to transshipment / transit, both inbound and outbound dwelling time will be counted. With the latest released data sets from S&P Global Market Intelligence Container Port Performance, we may compare some major container hubs in the region. Singapore do perform the best (2.68 days for import and 4.10 days for export) in both ways on this snapshot, followed by Shanghai, with average dwelling hours 3.25 days and 4.66 days, respectively.
Cargo Catchment (Hinterland)
There are other reasons these ports are selected as transshipment hubs. Across major alternate hubs like Mainland China and Singapore, however, these underlying reasons may differ. China mainland ports act as frequent transshipment hubs and is piloting international transshipment practices in recent years, but more of the cargo catchment market for the adjacent hinterland, i.e. gateway ports, thanks to its close proximity to those cargo originating markets; while Singapore is advanced in facilitating business environment and high efficiency with more mature transshipment measures, such as not subject to duty or GST, implementing 'single window' system for data reporting as well as informative step-to-step guidance for tranship procedures. (Reference: https://www.customs.gov.sg/businesses/transhipping-goods/quick-guide-on-transhipping-goods).
Below are some vessels carrying shipments loaded from Southeast and passing Yantian, Shanghai / Yangshan, and Ningbo individually before arriving in U.S. as the destination market.

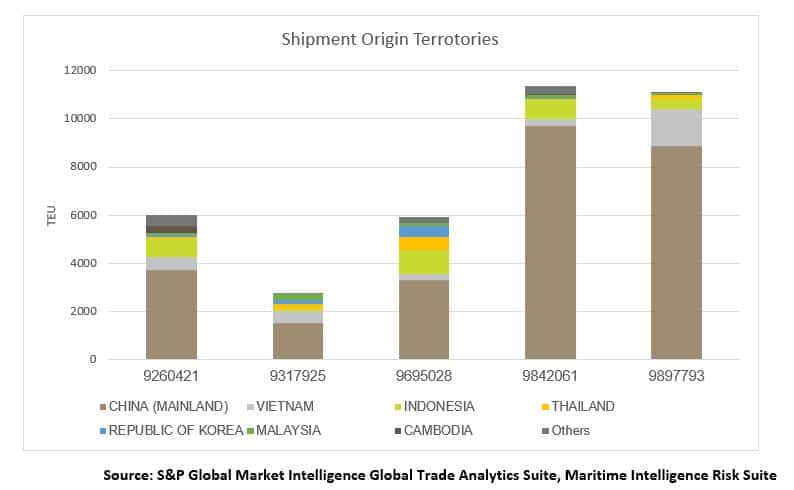
Mainland China markets still account for the majority of each of above ship's capacity, leaving the rest of the space booked by the shippers in other territories - e.g. ANNA MAERSK (IMO 9260421) with a total capacity of 7,226 TEU, carried 750 TEU from Indonesia, 545 TEU from Vietnam, in addition to 3,718 TEU from Mainland China. Other cargo originations include Cambodia, Thailand, etc. Aggregated cargo volume was 6,021 TEU, meaning that on the eastbound transpacific voyage in September 2022, the utilisation rate for the ANNA MAERSK was around 83.3%; on another case, CMA CGM LIBERTY (IMO 9897793) with a total capacity of 14,846 TEU, loaded 8,871 TEU from mainland China, together with 1,552 TEU from Vietnam and 407 TEU from Indonesia, the utilisation rate of cargo space was around 74.8%.
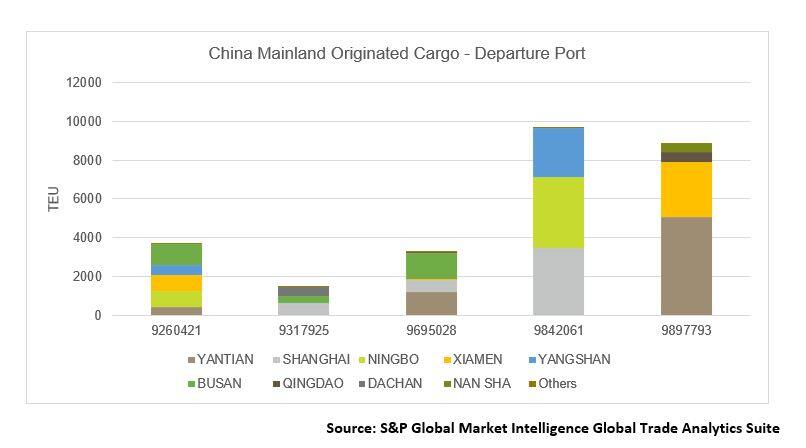
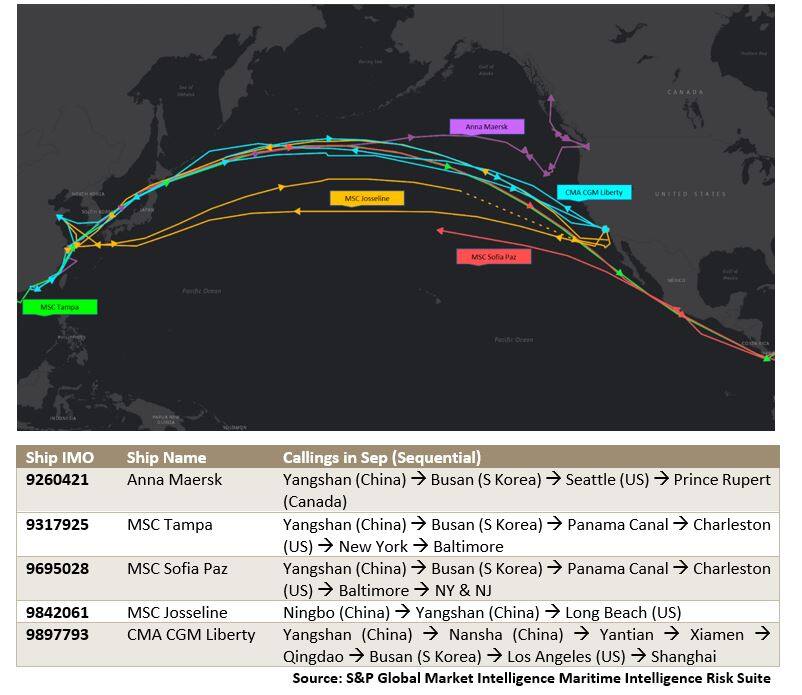
Focusing on cargo loaded from Mainland China onto the vessels, we may observe some typical calling patterns. On the same voyage, not all major container hubs are called. For example, the MSC JOSSELINE and CMA CGM LIBERTY involved quite different routes in terms of loading locations: while the former loaded cargo from Shanghai, Yangshan (also part of Shanghai), and Ningbo Port (Yangtze Delta), the latter was sailing from southern China ports, i.e. Yantian and Xiamen (Pearl River Delta). On the other side, the three smaller vessels, while with more diverse cargo origins, are making more short-distance journeys - calling at multiple regional ports before crossing the Pacific toward the United States.
This is evidenced if we track these ships' routes and calling records in September 2022 with the data by S&P Global Market Intelligence's Maritime Intelligence Risk Suite.
Conclusion and Implication
This analysis has demonstrated how trade and logistics networks are often complex. The end-to-end delivery of cargo is not a peer-to-peer transaction. However, trade data can help reveal the global shipping network, especially when analysing in combination with maritime analytics.
With trade demand and freight markets both experiencing roller coaster-style fluctuation in the past two years, and reeling from a seemingly ongoing VUCA (Volatile, Uncertain, Complex, Ambiguous) era, we shall not neglect the nuances when making decisions about reshaping supply chain networks and thus justifying why supply chain professionals should be informed with maritime and trade data to power their planning and operations:
- Uneven recovery and development of merchandise trade on different trade lanes. The shifting of trade patterns is not straightforward or single-direction and could be an evolving progress. As a result, shipping demand development is also dynamic with twisting factors of both regional economic and industrial growth, tariff rates as well as the level of resilience.
- A driving force of trade activities are multi-national corporates. As corporates will be more focusing on reliable supply chains, which a primary aim of ensuring on time and in full delivery of the goods and materials to support their operations and businesses. The decision will be a result of multi-factor functions.
- Non-direct shipping as a common practice in container shipping is likely to be the mainstream in foreseeable future. This means operational efficiency - whether it is transit or tranship, all en-route ports of calling before arriving at the destination will all determine the total voyage time and performance. A single "chokepoint" may result in the full 'failure' in achieving "On Time and In Full".
- With a boom in newbuilding ordering, additional containership capacity will enter into market bringing pressure on freight, in a time that demand is downward. A common occurrence during unfavourable market conditions is carriers cancelling sailing schedules or skipping certain ports of call. Any significant trade shift may also encourage carriers to re-deploy fleet and adjust their schedules. Yet considering the capacity of port and terminal infrastructure, and the border procedures, transit formalities and the total dwelling and voyage time, the deployment planning might neither be a single-factor decision. Sufficient cargo catchment, slot utilisation and cost of operation are among the factors to be considered.
- Environment regulations such as IMO 2023 which come into force soon will bring more complexity. The requirement on emission control will bring advantages to those more efficient ports/terminals for shortened waiting and dwelling time.
- Free trade agreements may affect strategies. FTAs not only cover tariff arrangements, but also include a large chunk of content on non-tariff measures, such as border enforcement, reporting requirements and Technical Barriers to Trade etc., all of which could effectively impacting on the cargo movements.
Subscribe to our monthly newsletter and stay up-to-date with our latest analytics
This article was published by S&P Global Market Intelligence and not by S&P Global Ratings, which is a separately managed division of S&P Global.
{"items" : [
{"name":"share","enabled":true,"desc":"<strong>Share</strong>","mobdesc":"Share","options":[ {"name":"facebook","url":"https://www.facebook.com/sharer.php?u=http%3a%2f%2fssl.ihsmarkit.com%2fmarketintelligence%2fen%2fmi%2fresearch-analysis%2ftrade-route-question-connecting-or-direct-shipping-.html","enabled":true},{"name":"twitter","url":"https://twitter.com/intent/tweet?url=http%3a%2f%2fssl.ihsmarkit.com%2fmarketintelligence%2fen%2fmi%2fresearch-analysis%2ftrade-route-question-connecting-or-direct-shipping-.html&text=Trade+Route+Question%3a+Connecting+or+Direct+Shipping%3f++%7c+IHS+Markit+","enabled":true},{"name":"linkedin","url":"https://www.linkedin.com/sharing/share-offsite/?url=http%3a%2f%2fssl.ihsmarkit.com%2fmarketintelligence%2fen%2fmi%2fresearch-analysis%2ftrade-route-question-connecting-or-direct-shipping-.html","enabled":true},{"name":"email","url":"?subject=Trade Route Question: Connecting or Direct Shipping? | IHS Markit &body=http%3a%2f%2fssl.ihsmarkit.com%2fmarketintelligence%2fen%2fmi%2fresearch-analysis%2ftrade-route-question-connecting-or-direct-shipping-.html","enabled":true},{"name":"whatsapp","url":"https://api.whatsapp.com/send?text=Trade+Route+Question%3a+Connecting+or+Direct+Shipping%3f++%7c+IHS+Markit+ http%3a%2f%2fssl.ihsmarkit.com%2fmarketintelligence%2fen%2fmi%2fresearch-analysis%2ftrade-route-question-connecting-or-direct-shipping-.html","enabled":true}]}, {"name":"rtt","enabled":true,"mobdesc":"Top"}
]}


