Trade analysis: China's steel and iron exports
Key points:
- Global exports of iron and steel amounted to 541,429,984 metric tons in 2019. It was 553,802,285 metric tons in 2016 which represents a contraction by 2.23%.
- Top exporters include China, Russia, Japan, South Korea, and Germany. Top importers include the United States, Germany, Italy, China and South Korea.
- China is by far the largest exporter of iron and steel in 2019 having exported 87.3 million metric tons which equals approximately 15.8 % of global exports; it represents a 29.5% decrease from 2016 (a fall of 36,442,776.2 metric tons in absolute values).
- Chinese exports of iron and steel increased the most in the analyzed period (2016-19) in the case of the United States, Nigeria, Chile, Brazil, Uzbekistan, Colombia and Russia.
- The largest drops appeared in the case of Asian trade partners of China in particular from East and South-east Asia: Japan, Pakistan, Taiwan, India, Singapore, Malaysia, Turkey, Hong Kong SAR, Saudi Arabia, Indonesia, Thailand, and in particular Vietnam and South Korea. The fall was mostly due to the overall weaker demand for iron and steel in these markets in general and an increased domestic production potential.
- Closer investigation showed that imports from China were to some extent replaced (depending on a country) by imports from Vietnam or other countries in the region (Malaysia, Japan, India, Indonesia, Thailand, Taiwan, South Korea), the Persian Gulf States (UAE, Oman, Iran, Bahrain and Pakistan), as well as from Turkey, South Africa, Russia and Brazil.
- The market is heavily regulated with a large number of trade remedies present. The largest number of trade remedies in the sector against China in action at present as reported by the WTO include the US, European Union, Canada, Brazil, Mexico and Thailand. The antidumping duties clearly dominate over countervailing duties. With some countries only having established suspension agreements (e.g. Taiwan, Ukraine, South Korea, Russian Federation).
- IHS Markit predicts global exports of iron and steel to reach 551,765,252.6 metric tons in 2020 and thus to increase by 1.9% y/y with Chinese exports predicted to reach 89,267,324 metric tons which represents an increase of 2.2% y/y (above of the world average)
Background information
China was the world's largest exporter of iron and steel in 2019. The volume of China's 2019 exports was almost double that of the world's second-largest exporter, Russia, and roughly 2.5-times the exports of Japan and South Korea.
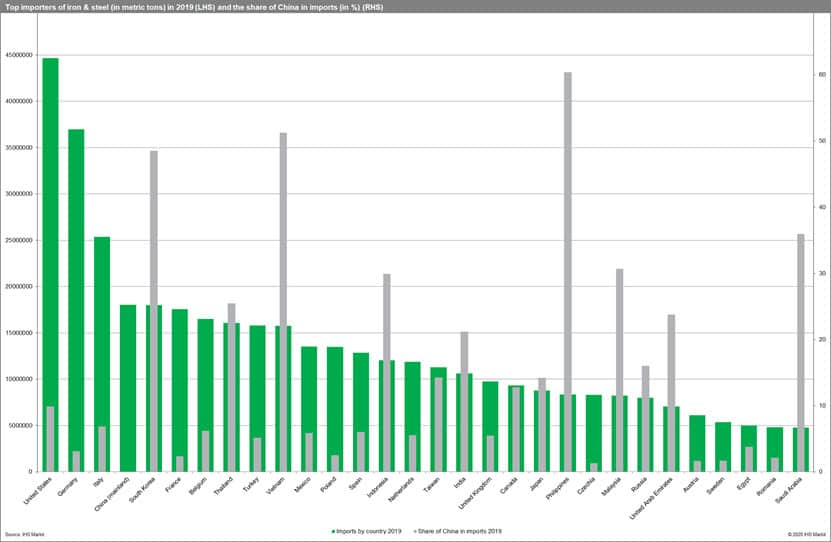
China exported 87.3 million metric tons. It represents a 29.5% decrease from 2016 (a fall of 36,442,776.2 metric tons in absolute values). In 2019 China's exports represented about 15.8 % of global exports. It was 22.5% in 2016 (the peak year in Chinese exports equal to 123,756,735 metric tons). At the same time, China in 2019 was the world's fourth-largest importer of iron and steel commodities after the United States, Germany and Italy and in front of South Korea, France, Belgium, Thailand, Turkey and Vietnam.
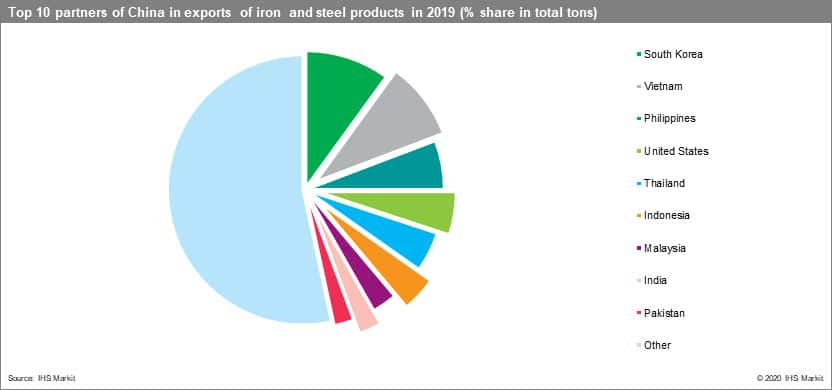
China exported iron and steel commodities to 224 countries and territories in 2019. In 2016, it was 223. The top five countries account for approximately 35% of Chinese exports, top ten for around 50% and the top 25 for 73%. Thus, Chinese exports are strongly concentrated in top destinations.
Global iron and steel trade
Global exports of iron and steel amounted to 541,429,984 metric tons in 2019. It was 553,802,285 metric tons in 2016 which represents a contraction of 2.23%. Top exporters include China, Russia, Japan, South Korea and Germany. Top importers include the United States, Germany, Italy, China and South Korea.
IHS Markit predicts global exports of iron and steel to reach 551,765,252.6 metric tons in 2020 and thus to increase by 1.9% y/y with Chinese exports predicted to reach 89,267,324 metric tons which represents an increase of 2.2% y/y (above of the world average). The actual figure will to a large extent depend on the rate of growth of the global economy with relatively good prospects and several adverse factors (escalation of the trade war, increasing global political and economic instability, tensions in the Persian Gulf etc.).
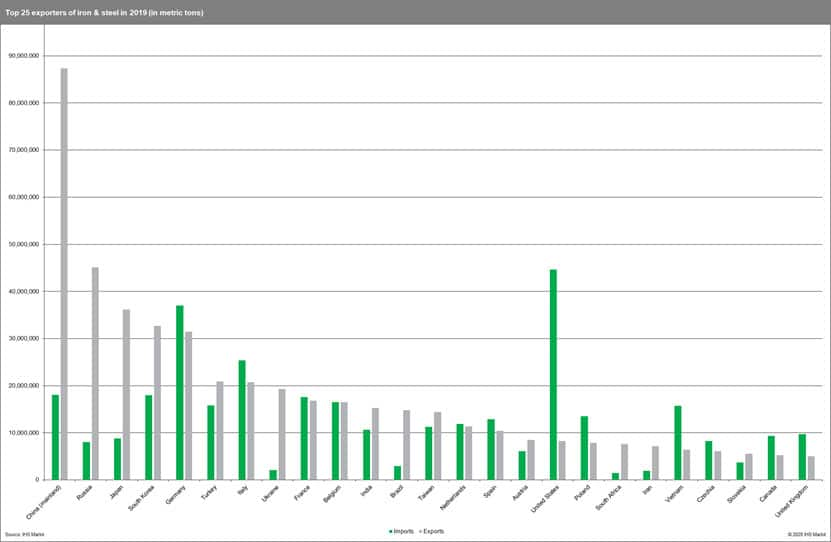
Map 1. Global exports of iron and steel, 2019 (metric tons)
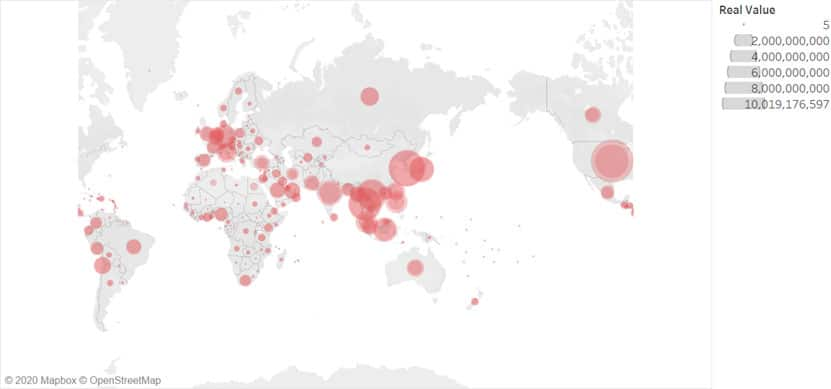
Map 2. Global imports of iron and steel, 2019 (metric tons)
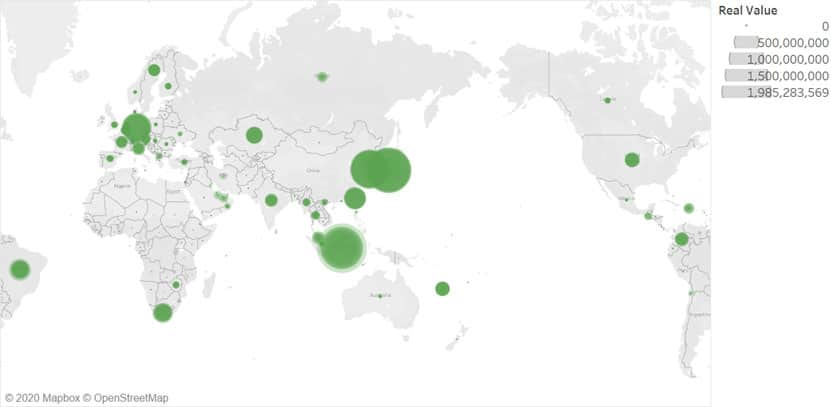
Map 3. Global exports of iron and steel, % change in 2019 from 2018
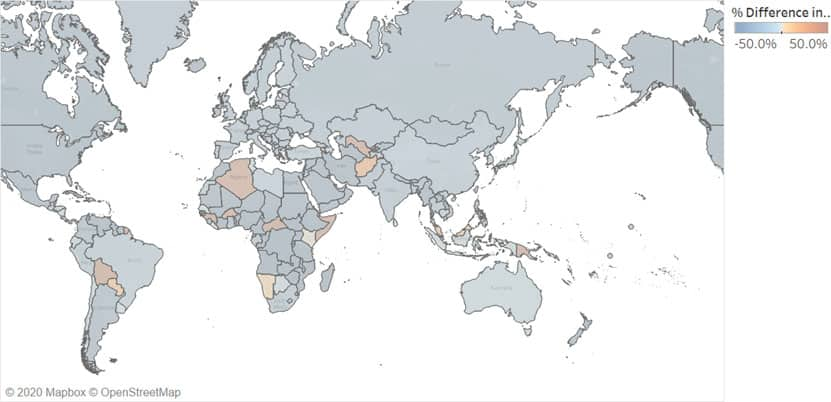
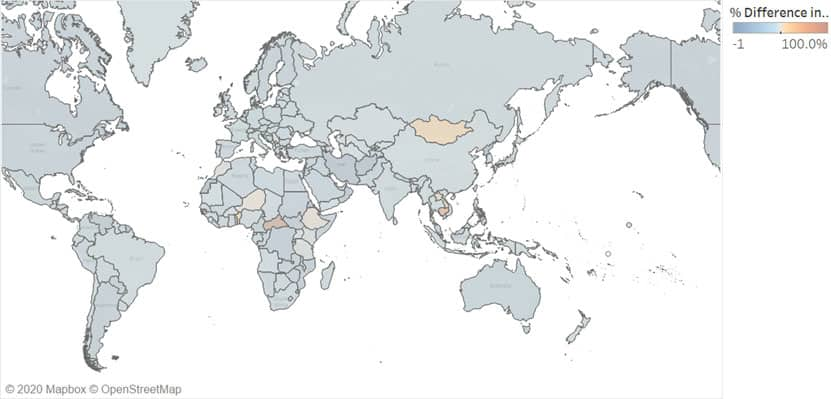
Map 4. Global imports of iron and steel, % change in 2019 from 2018
Production of steel in China
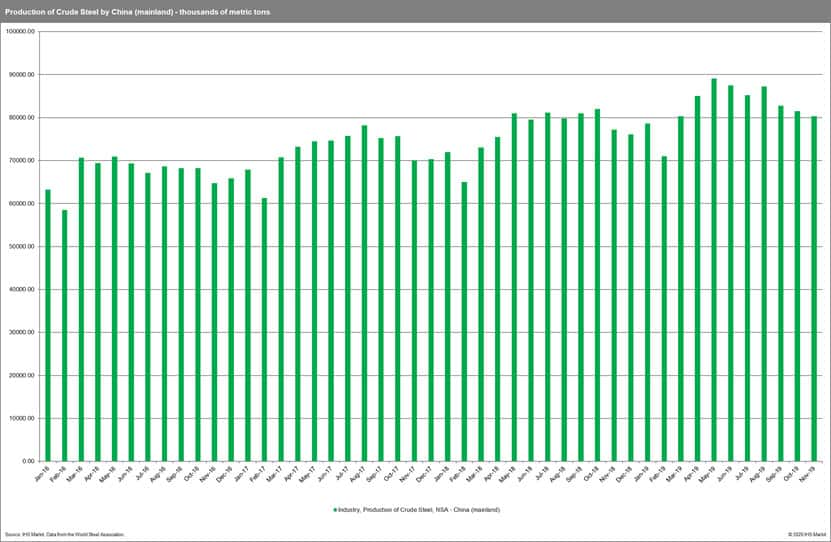
The monthly production of crude steel by China (mainland) is showing overall an upward trend in the analyzed period (January 2016 - November 2019) rising by approximately 14.5 thousand metric tons per month. Cyclicality is also evident with the top production in August. Nonetheless, in 2019, the production peak was reached in April (89,100 thousand metric tons) and then steadily declined to around 80,000 thousand metric tons in November. It is worth stressing that most of the Chinese steel production is locally consumed and allocated to local construction and large manufacturing industry.
Prospects for the Chinese economy
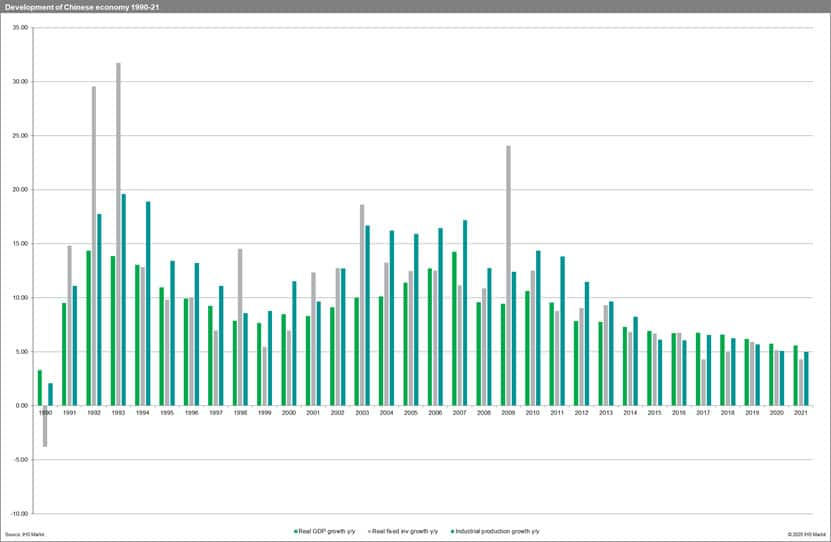
The Chinese economy is slowly slowing down with real GDP y/y growth rates forecasted to 5.7 and 5.6 in 2020 and 2021 respectively (the most recent maximum was reached in 2010, and the rates were even higher prior to the global financial meltdown in 2008). Real fixed investment growth y/y is predicted to reach 5.1 and 4.3, and industrial production 5.1 and 5.0 respectively. The local demand for iron and steel is thus likely to increase but at a lower speed.
China's trade in iron and steel by trade partners
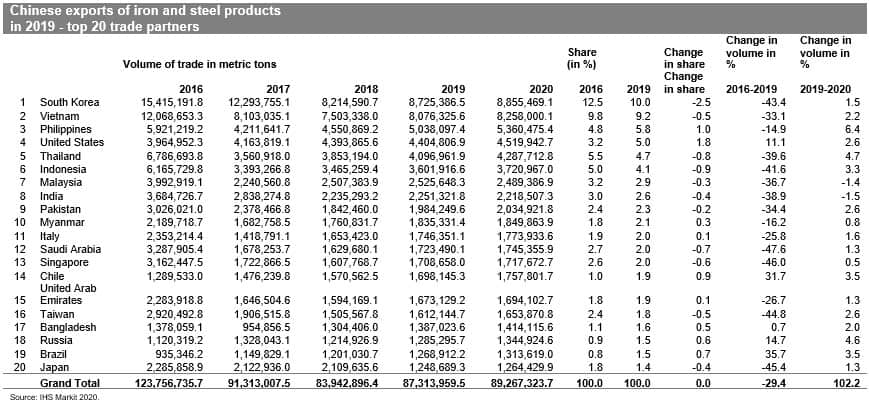
Top trade partners of China in iron and steel exports include South Korea, Vietnam, the Philippines, United States, and Thailand.
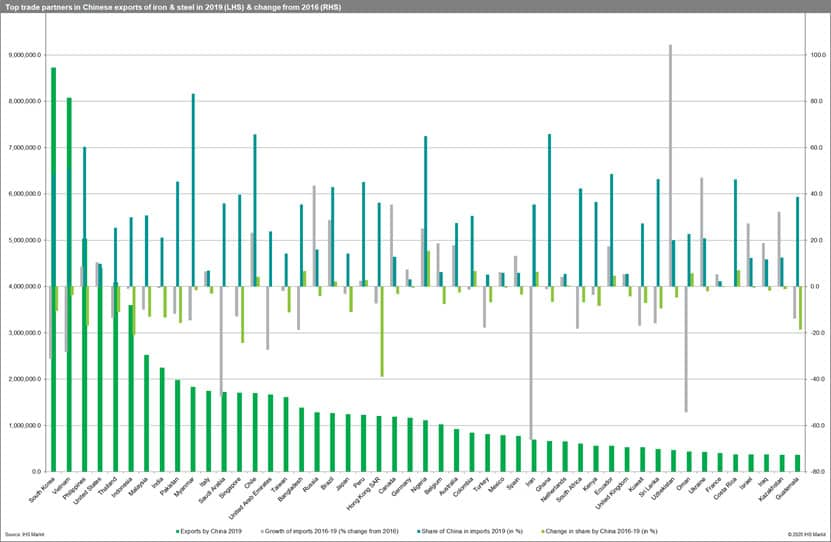
The share of China in imports of iron and steel in 2019 was the highest in the case of Monaco (99.1%), North Korea (95.5%) and Brunei (84.5%). In the case of the largest 50 importer's, it was the highest for Chile (65.7%), the Philippines (60.4%), Vietnam (51.3%) and South Korea (48.5%). For 30 trade partners, the share of China in 2019 exceeded the 50% benchmark. On average the share of China is the highest in the case of bordering East and South-east Asian states.
China lost share in imports of iron and steel with 131 countries between 2016-19 (the highest were in the case of Panama, Haiti, Cuba, Lebanon, and Hong Kong SAR). It increased the share in the case of 83 trade partners.
Chinese exports of iron and steel increased the most in the analyzed period (2016-19) in the case of United States (+439,854.7 metric tons), Nigeria (+433,667.4), Chile (+408,612.3), Brazil (+333,566.0), Uzbekistan (+187,315.0), Colombia ( +176,753.1 ) and Russia ( +164,976.5).
The largest drops appeared in the case of Asian trade partners of China in particular from East and South-east Asia Japan (-1,037,169.6 metric tons), Pakistan (-1,041,771.4), Taiwan (-1,308,348.1), India (-1,433,404.9), Singapore (-1,453,789.5), Malaysia (-1,467,270.8), Turkey (-1,475,829.6), Hong Kong SAR (-1,484,486.9), Saudi Arabia (-1,564,415.3), Indonesia (-2,563,813.2), Thailand (-2,689,731.9), Vietnam (-3,992,327.6) and South Korea (-6,689,805.3). More detailed analysis shows that this is mostly due to the overall weaker demand for iron and steel in these markets in general (an overall decrease in imports of iron and steel product) and the increased domestic production potential. Closer investigation showed that the imports from China were to some extent replaced (depending on a country) by imports from Vietnam or other countries in the region (Malaysia, Japan, India, Indonesia, Thailand, Taiwan, South Korea), the Persian Gulf States (UAE, Oman, Iran, Bahrain and Pakistan), as well as from Turkey, South Africa, Russia and Brazil.
Trade barriers
It is worth stressing that the trade in iron and steel is heavily regulated and the number of measures in force as reported by the World Trade Organization in particular on steel against China is high. These trade remedies include anti-dumping duties (AD), countervailing duties (CVD), associated suspension agreements, and safeguards. These are internationally agreed-upon mechanisms to address the market-distortions, serious injuries or threat of serious injury caused by a sudden increase in imports. Before applying these duties or measures, countries investigate allegations and can remedy or provide relief for the injury caused to a domestic industry. At this stage, the largest number of trade remedies in the sector against China are present in the case of the US, European Union, Canada, Brazil, Mexico and Thailand. The antidumping duties clearly dominate over countervailing duties. With some countries only having established suspension agreements (e.g. Taiwan, Ukraine, South Korea, Russian Federation).
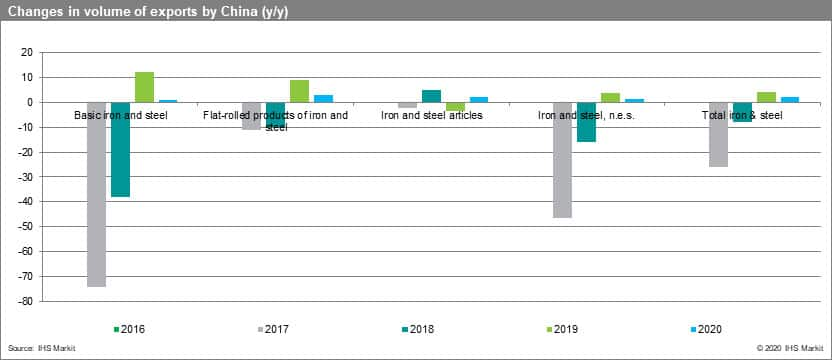
Export volume by commodity groups
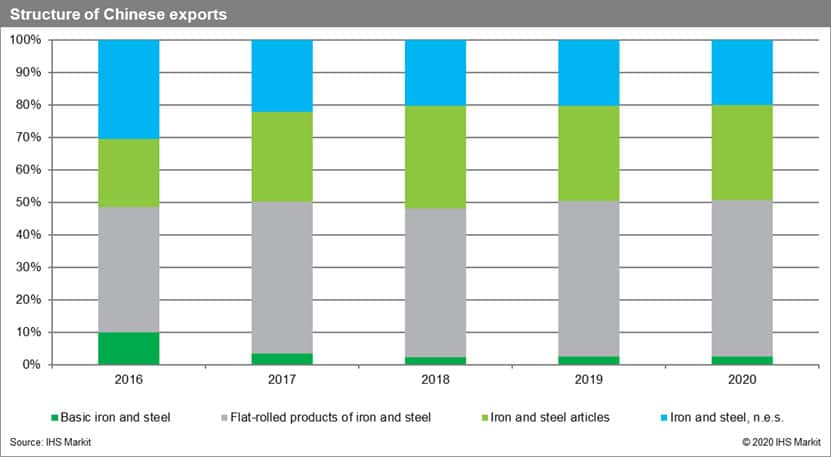
Flat-rolled products of iron and steel clearly dominate Chinese exports and are followed by iron and steel articles. The role of basic iron and steel is decreasing.
This column is based on data from IHS Markit Global Trade Atlas (GTA) and GTA Forecasting and other resources from IHS Markit if not stated otherwise. 2020 and 2021 values are predictions. 2019 data are estimated as historical data are available till Q3 2019.
In the IHS Markit GTA Forecasting database iron and steel commodities are present in four commodity groups: basic iron and steel, flat-rolled products of iron and steel, iron and steel, n.e.s. and iron and steel articles.