Customer Logins
Obtain the data you need to make the most informed decisions by accessing our extensive portfolio of information, analytics, and expertise. Sign in to the product or service center of your choice.
Customer Logins
BLOG
Jul 14, 2021
Russian crude exports declined in first half of July, after surpassing 3 MMbpd in June
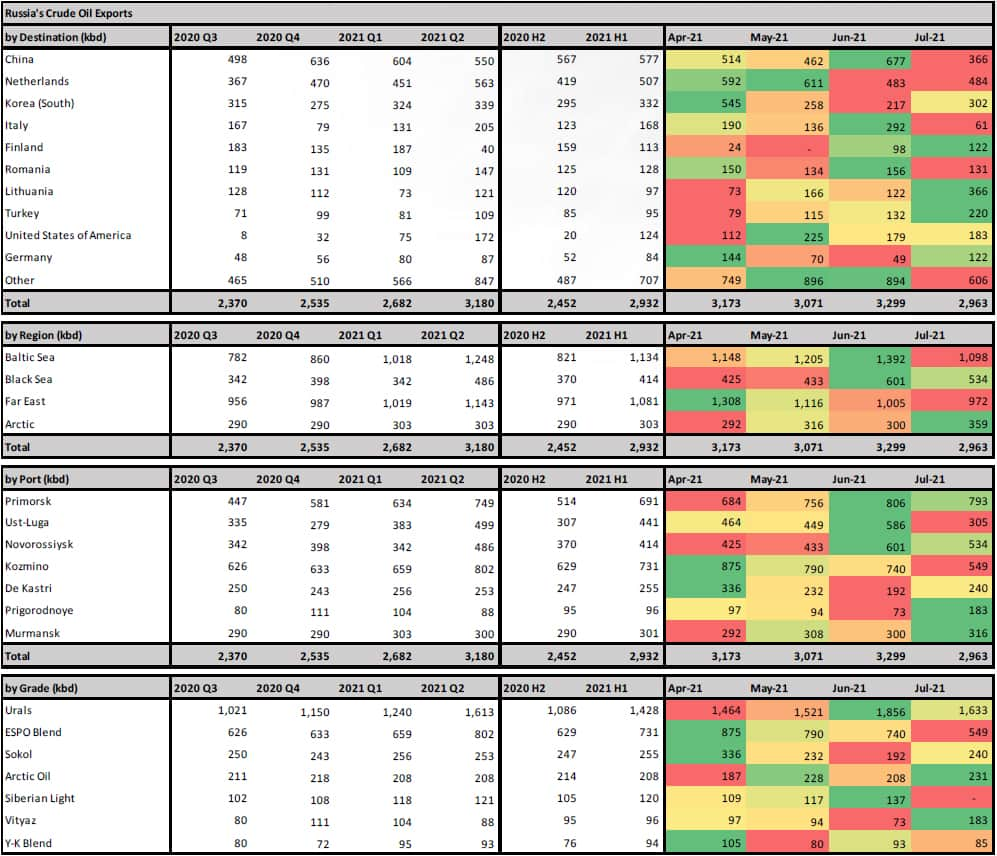
Russia's crude oil exports to China reached 680,000 b/d in June, the highest since January, compared to just 462,000 b/d in May 2021. ESPO Blend crude oil loaded in June and bound for China rose to 570,000 b/d during the month, also the highest since January, according to data from IHS Markit Commodities at Sea.
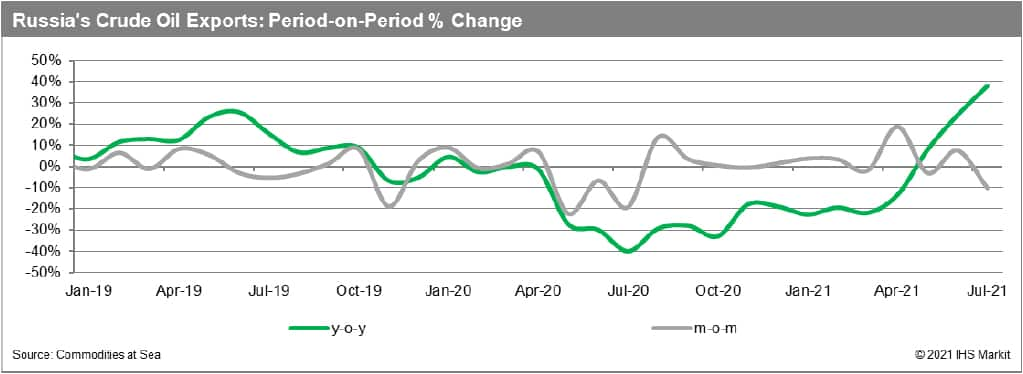
Threequarters of the ESPO volumes were delivered to Shandong province, with at least two cargoes going to ChemChina. The rebound comes after ESPO had been competing against alternative grades in the last few months, as more Iranian crude moved to China. The remainder of Russian crude heading to China in June comprised a single 1 million-barrel cargo of Urals crude, which is set to arrive in Ningbo in the coming days, having loaded from Novorossiysk in mid June. Overall Russian crude exports to China slipped 8.5% on year in June, with H1 volumes at 577,000 b/d, down from 800,000 b/d in 2020 H1.
With the gradual easing of OPEC+ production restrictions, total Russian crude oil exports in June rose to a 14-month high of 3.3 million b/d, with Urals averaging 1.85 million b/d, the highest since April 2020. Exports of this grade averaged 1.43 million b/d in H1 2021. Total shipments of ESPO Blend fell to 740,000 b/d in June, with preliminary data for July showing exports of just 550,000 b/d in the first 12 days of the month.
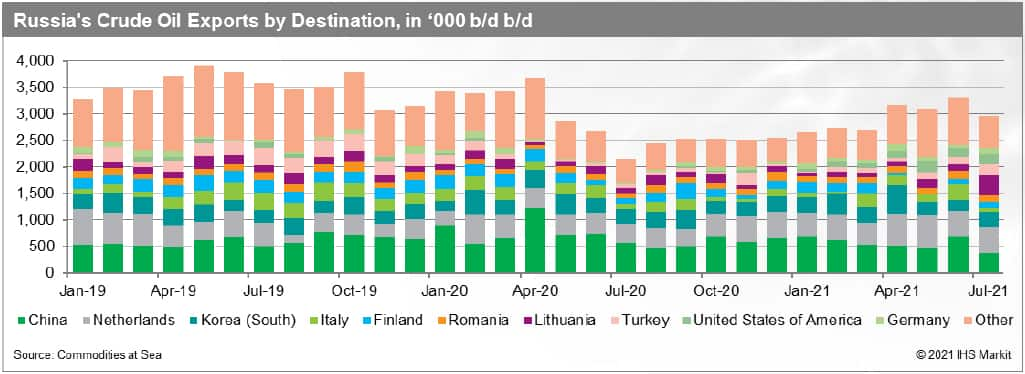
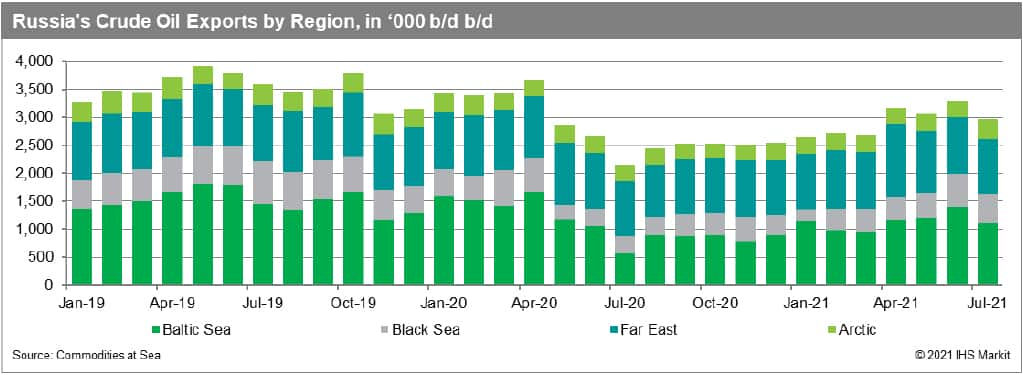
Exports to Netherlands declined to 483,000 b/d in June, from 611,000 b/d in May. However, this was still 26% more than a year ago. Shipments to Europe seem to maintain last month's levels in first half of July, with a marginal increase observed in flows to Turkey, Finland and Lithuania. Exports from the Arctic Sea will remain above 300,000 b/d for a third consecutive month in July.
Russian crude cargoes with destination indicating USA dropped below 180,000 b/d in June, compared to 225,000 b/d in May. Shipments to USA averaged 84,000 b/d in 2021 H1 and 52,000 b/d in 2020 H2. Exports heading for the USA stand just above 180,000 b/d in the first two weeks of July.
Flows to the Far East could marginally strengthen in July, with shipments of Sokol so far in July up, having reached 240,000 b/d. Russia's daily crude oil and condensate output is estimated to have marginally declined in June over month, with crude output, subject to the OPEC+ agreement, kept below 9.5 million b/d, marginally above the country's quota for the month.
While speculation around the OPEC+ output curbs' impact to several Russian fields has been rife in the last year, Russia appears to have maintained most of its pre pandemic upstream production capacity, which could push exports closer to the 3.7 million b/d seen in April 2020.
Output could potentially be boosted by around 700,000 b/d within the next 12 months, returning levels to near the annual production record of 11.25 million b/d of 2019, according to IHS Markit.
Russian producers had been pushing for further easing of restrictions which would have allowed additional output of 125,000 b/d in August but the current stand-off between Saudi Arabia and the UAE has delayed any potential change to the OPEC+ terms. The latter has been pushing for a production increase to keep pace with rising production capacity while Saudi Arabia is adopting a cautious stance.
OPEC+ will next meet in early August and if a new deal cannot be reached the group will proceed with the existing agreement, which is to keep production caps intact until end March 2022. Russia however is sitting comfortably as oil prices are well above the country's threshold of $44/bbl needed to balance its finances. The country is likely to emerge with a budget surplus this year and the economy ministry earlier in July revised its 2021 GDP growth to 3.8% from 2.9% in April. With a rebound in consumer demand, inflation is set to overshoot expectations and the central bank has indicated it will raise interest rates to curb rising prices.

Source: IHS Markit Commodities at Sea (© 2021 IHS Markit)
*The colour scales apply to all cells in a row, reflecting the value in each cell in relation to others. The highest value is green and the lowest is red.


For more insight subscribe to our complimentary commodity analytics newsletter
{"items" : [
{"name":"share","enabled":true,"desc":"<strong>Share</strong>","mobdesc":"Share","options":[ {"name":"facebook","url":"https://www.facebook.com/sharer.php?u=http%3a%2f%2fssl.ihsmarkit.com%2fmarketintelligence%2fen%2fmi%2fresearch-analysis%2frussian-crude-exports-declined-in-first-half-of-july.html","enabled":true},{"name":"twitter","url":"https://twitter.com/intent/tweet?url=http%3a%2f%2fssl.ihsmarkit.com%2fmarketintelligence%2fen%2fmi%2fresearch-analysis%2frussian-crude-exports-declined-in-first-half-of-july.html&text=Russian+crude+exports+declined+in+first+half+of+July%2c+after+surpassing+3+MMbpd+in+June+%7c+S%26P+Global+","enabled":true},{"name":"linkedin","url":"https://www.linkedin.com/sharing/share-offsite/?url=http%3a%2f%2fssl.ihsmarkit.com%2fmarketintelligence%2fen%2fmi%2fresearch-analysis%2frussian-crude-exports-declined-in-first-half-of-july.html","enabled":true},{"name":"email","url":"?subject=Russian crude exports declined in first half of July, after surpassing 3 MMbpd in June | S&P Global &body=http%3a%2f%2fssl.ihsmarkit.com%2fmarketintelligence%2fen%2fmi%2fresearch-analysis%2frussian-crude-exports-declined-in-first-half-of-july.html","enabled":true},{"name":"whatsapp","url":"https://api.whatsapp.com/send?text=Russian+crude+exports+declined+in+first+half+of+July%2c+after+surpassing+3+MMbpd+in+June+%7c+S%26P+Global+ http%3a%2f%2fssl.ihsmarkit.com%2fmarketintelligence%2fen%2fmi%2fresearch-analysis%2frussian-crude-exports-declined-in-first-half-of-july.html","enabled":true}]}, {"name":"rtt","enabled":true,"mobdesc":"Top"}
]}


