Customer Logins
Obtain the data you need to make the most informed decisions by accessing our extensive portfolio of information, analytics, and expertise. Sign in to the product or service center of your choice.
Customer Logins
BLOG
Sep 01, 2021
Recovery in global trade clearly sustained and broad with more moderate forecasts for Q3 & Q4 (Monthly Global Trade Monitor – AUGUST 2021)
This analytics article utilizes trade data published by IHS Markit Global Trade Atlas (GTA)
Key Observations
- The data on growth rates point to a sustained recovery in trade (both exports and imports) among the top 10 economies from Q1 in some and Q2 in all top 10 states
- The growth rate of Chinese exports in July 2021 is the lowest since the beginning of the year, and the same applies to Brazil (since March) and South Korea (since April 2021); the period of elevated growth rates observed in trade is coming to a close
- If we compare the value of exports to the last month's preceding the global pandemic, we see that by now, all states report export levels higher than in December 2019
- As to the shape of the Covid-19 crisis, it is clear by now that this resembles modified V - with a rapid decrease in Q1/Q2 2020 followed by a much more moderate recovery
- The recovery in exports in Q1 2021 is clear in all sectors apart from silk, wool, nickel, aircraft, and works of art and to a lesser extent in mineral fuels and fish. In most sectors, recovery started already in Q3 2020, and then the number of recovering sectors increased from quarter to quarter
- Recent econometric analysis by GTAS Forecasting on global monthly bilateral trade flows shows that COVID-19 still exerts a negative impact on international trade flows; however, the adverse impact is slowly diminishing in magnitude
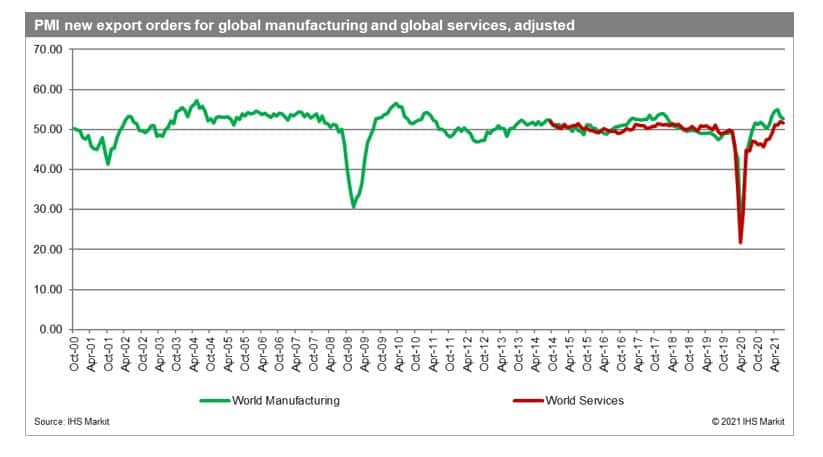
- Both PMI NExO in July 2021 for global manufacturing (52.72) and global services (51.59) are above the 50.0 points the fourth month in a row, making a recovery in the global economy clearly sustainable
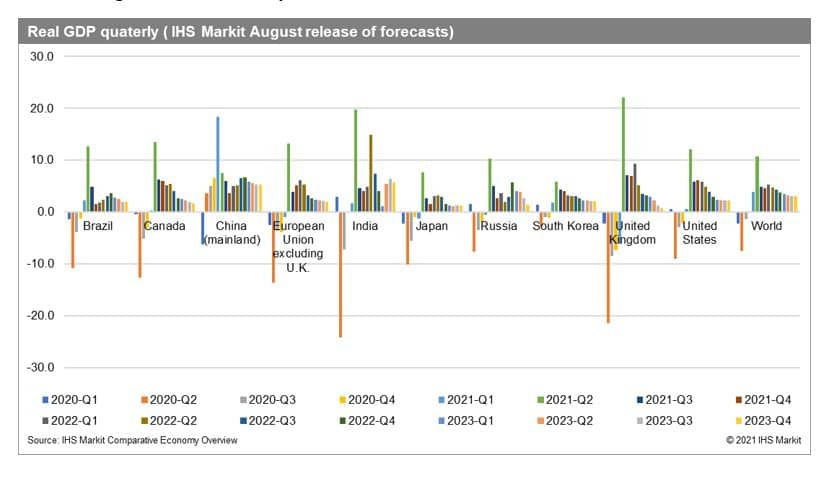
- Real GDP growth rates in Q3 & Q4 are forecasted in the GLM model to be positive but much more moderated. It seems we are over the top of recovery in reported real GDP growth rates, similarly to data on trade
Changes in Trade of the Top 10 Economies
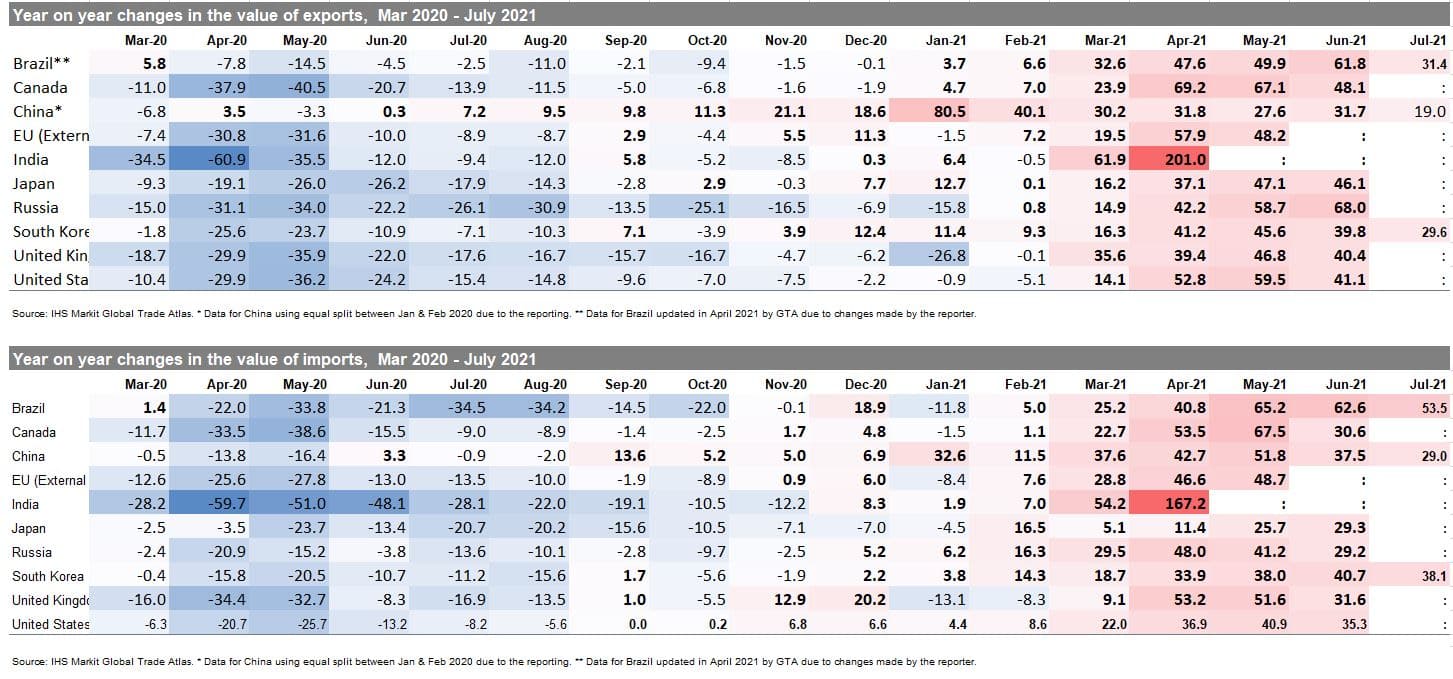
- With data steadily incoming from the monthly reporters and included in the Global Trade Atlas (GTA), we are able to look at the complete two quarters of 2021 for most of the top ten economies
- The data on growth rates point to a sustained recovery in trade (both exports and imports) among the top 10 economies from Q1 in some and Q2 in all the states under analysis
- Looking from a monthly perspective, Chinese exports are growing consistently from June 2020 onwards (14th month in a row) and imports from September 2020 (11th month in a row)
- Exports are growing in all the top 10 states from March 2021 onwards, with the situation in the first two months more nuanced; imports, in turn, started growing in all the states a month earlier (Feb 2021) apart from the UK, which showed negative growth rates both in January and February
- Generally speaking, the growth rates reported by the top 10 are the highest in the months most adversely affected by the pandemic itself in 2020 and the initial strict reactions of the affected states in 2020 (mainly January to May) and thus moderate to lower levels in the later months of Q2 2021 and forthcoming quarters (the base effect)
- The highest yoy growth rates were observed in India in April 2021, both in exports (+201.0% yoy) and imports (+167.2% yoy), the state most adversely affected in April 2020; the base effect is thus apparent and has to be taken into account in the correct interpretation of the data
- Only three states have already reported data for July 2021 - Brazil, China & South Korea; the resulting yoy growth rates are positive but significantly lower than observed in the preceding months, in line with our earlier expectations; the growth rates are at the same time, higher in imports than in exports
- The growth rate of Chinese exports is the lowest since the beginning of the year; the same applies to Brazil (since March) and South Korea (since April 2021); it seems that the period of elevated growth rates observed in trade is coming to a close
- If we compare the value of exports to the last month preceding the global pandemic, we see that by now, all states report export levels higher than in December 2021; among the top 10, China recovered the fastest, although in relative terms, Brazil, reached the highest export levels
- As to the shape of the Covid-19 crisis, it is clear by now that this resembles modified V - with the rapid decrease in Q1/Q2 2020 followed by a much more moderate recovery

Source: IHS Markit Global Trade Atlas (© 2021 IHS Markit)

Sectoral perspective
- The present section looks at the top 10 economies exports at the quarterly level at the HS two-digit commodities disaggregation level. It allows identifying the asymmetric impact of COVID-19 on different sectors and the varying speed of recovery.
The Table with sectoral breakdown available to our Global Trade Analytics Suites (GTAS) clients only on Connect platform. Contacts IHS Markit Customer Care Customer.Care@ihsmarkit.com for details
- The recovery in exports in Q1 2021 is clear in all sectors apart from silk, wool, nickel, aircraft, and works of art and to a lesser extent in mineral fuels and fish. In most sectors, recovery started already in Q3 2020, and then the number of recovering sectors increased from quarter to quarter. Overall, Q4 2020 brought a general recovery (+3.5% yoy), and Q1 2021 generated the foreseen boost to top 10 exports (+16.5% yoy).
Prospects for the Forthcoming Months
- As we continually stress, the overall impact of COVID-19 on global trade and the global economy depends on the duration, severity, and spatial distribution of the pandemic (changing with the waves of the pandemic) and associated severity of containment efforts taken by individual states.
- Recent econometric analysis by GTAS Forecasting on global monthly bilateral trade flows shows that COVID-19 still exerts a negative impact on international trade flows; however, the adverse impact is slowly diminishing in magnitude (it is observed both for new cases, new deaths, as well as COVID-19 Government Response Tracker variables on gravity and stringency of response to the pandemic by individual states)
- The cumulative number of confirmed cases of COVID-19 globally by 22 August 2021 reached 211.3 million cases (exceeded 200 million cases threshold) and 4.42 million deaths
- The 2-week moving averages of global new cases and deaths stopped to decline in June and started rising again in July, with global average death rates following with a two-week delay; it seems that the fourth wave is with some states reintroducing stricter restrictions (including lockdowns, e.g., Australia or vaccination-status-based restrictions, e.g., France); on a positive note higher number of cases seems not to lead, to a similar extent, to an increase in the number of reported deaths.

- The reported number of vaccinations globally reached 5.08 billion with 1.95 billion people fully vaccinated, which is equivalent to 24.9% of the global population (still far from the worldwide herd immunity threshold);
- The adjusted PMI new exports orders (PMI NExO) readouts for the global manufacturing industry in July 2021 were above the benchmark value of 50.0 points (52.72) the 12th month in a row showing a sustained and positive short-term outlook for global trade. The values are pointing to increasing exports in all top 10 economies (apart from Russia, with declining outlook) with the highest values for the European Union (59.89), the US (54.84), India (54.82), and the United Kingdom (53.92)
- The readouts for August are by now available for the US (55.62), the UK (53.63), and Japan (50.52)
- Both PMI NExO in July 2021 for global manufacturing (52.72) and global services (51.59) are above the 50.0 points the fourth month in a row, making a recovery in the global economy sustainable; PMI NExO for global services, however, fell for the first time in more than half a year and, the manufacturing PMI NEx0 decreased for the second time

- The most recent real GDP growth forecasts from IHS Markit were published on 18 August 2021 and are based on the baseline scenario of the impact of COVID-19 on the global economy and rising global concerns over inflation and the presence of increasing once-again GVCs disruptions
- The now estimated contraction in real global GDP is -3.5% in 2020, varying between -4.5% for advanced, -1.6% for emerging, and -5.4% for the most affected developing economies
- We foresee a global recovery in 2021, with year-on-year real GDP growth rates predicted to reach 5.7%. The growth rates are expected to vary between 5.2% (4.0% in 2022) for advanced, 6.6% (5.1%) for emerging, and 5.1% (5.0%) for developing states
- Real global GDP contracted in every single quarter of 2020, with Q2 being the worst quarter. The estimated growth rate in Q1 2021 was 3.9% and varied between -0.1% for advanced and 10.0% for emerging economies. In Q2 2021, real global GDP is estimated to have grown by 10.7%, with the growth impulse stronger for advanced (12.2%) than emerging economies (8.5%). The prospects for Q3 and Q4 are positive, with growth rates moderating to 4.9% and 4.6% (lowered in comparison to prior forecasts from July), with growth stronger overall in advanced economies
- All top 10 are estimated to grow in Q2 and remaining quarters of 2021-22, with the strongest growth impulse in Q2 2021 in the UK (+22.1%), India (19.8%), Canada (+13.5%), the EU (+13.2%), Brazil (+12.7%) and the US (+12.2%); real GDP growth rates in Q3 & Q4 are forecasted to be positive but much more moderated, it seems, we are over the top of recovery in reported real GDP growth rates, similarly to data on trade

This column is based on data from IHS Markit Maritime & Trade Global Trade Atlas (GTA) & GTAS Forecasting.
For more details about Global Trade Atlas Forecasting please visit the product page
https://ihsmarkit.com/products/gta-forecasting.html
For more details about Global Trade Atlas (GTA) please visit the product page
https://ihsmarkit.com/products/maritime-global-trade-atlas.html
The full version of this article is available on the Connect platform for IHS Markit clients with a subscription to GTA/GTA Forecasting or GTAS Suite.
*Please note that China (mainland) reported an aggregated value of trade for January-February 2020 - for the year 2020 the data in the GTA database were equally split between the two months.
Please note that Brazil has revised data for 2020 affecting the reported growth rates (please be careful not to compare the current Global Trade Monitoring Report with prior editions due to significant changes)
{"items" : [
{"name":"share","enabled":true,"desc":"<strong>Share</strong>","mobdesc":"Share","options":[ {"name":"facebook","url":"https://www.facebook.com/sharer.php?u=http%3a%2f%2fssl.ihsmarkit.com%2fmarketintelligence%2fen%2fmi%2fresearch-analysis%2frecovery-in-global-trade-sustained-broad-with-more-moderate.html","enabled":true},{"name":"twitter","url":"https://twitter.com/intent/tweet?url=http%3a%2f%2fssl.ihsmarkit.com%2fmarketintelligence%2fen%2fmi%2fresearch-analysis%2frecovery-in-global-trade-sustained-broad-with-more-moderate.html&text=Recovery+in+global+trade+clearly+sustained+and+broad+with+more+moderate+forecasts+for+Q3+%26+Q4+(Monthly+Global+Trade+Monitor+%e2%80%93+AUGUST+2021)","enabled":true},{"name":"linkedin","url":"https://www.linkedin.com/sharing/share-offsite/?url=http%3a%2f%2fssl.ihsmarkit.com%2fmarketintelligence%2fen%2fmi%2fresearch-analysis%2frecovery-in-global-trade-sustained-broad-with-more-moderate.html","enabled":true},{"name":"email","url":"?subject=Recovery in global trade clearly sustained and broad with more moderate forecasts for Q3 & Q4 (Monthly Global Trade Monitor – AUGUST 2021)&body=http%3a%2f%2fssl.ihsmarkit.com%2fmarketintelligence%2fen%2fmi%2fresearch-analysis%2frecovery-in-global-trade-sustained-broad-with-more-moderate.html","enabled":true},{"name":"whatsapp","url":"https://api.whatsapp.com/send?text=Recovery+in+global+trade+clearly+sustained+and+broad+with+more+moderate+forecasts+for+Q3+%26+Q4+(Monthly+Global+Trade+Monitor+%e2%80%93+AUGUST+2021) http%3a%2f%2fssl.ihsmarkit.com%2fmarketintelligence%2fen%2fmi%2fresearch-analysis%2frecovery-in-global-trade-sustained-broad-with-more-moderate.html","enabled":true}]}, {"name":"rtt","enabled":true,"mobdesc":"Top"}
]}


