Customer Logins
Obtain the data you need to make the most informed decisions by accessing our extensive portfolio of information, analytics, and expertise. Sign in to the product or service center of your choice.
Customer Logins
EQUITIES COMMENTARY
Mar 23, 2020
Historic coronavirus fear index
Research Signals - March 2020
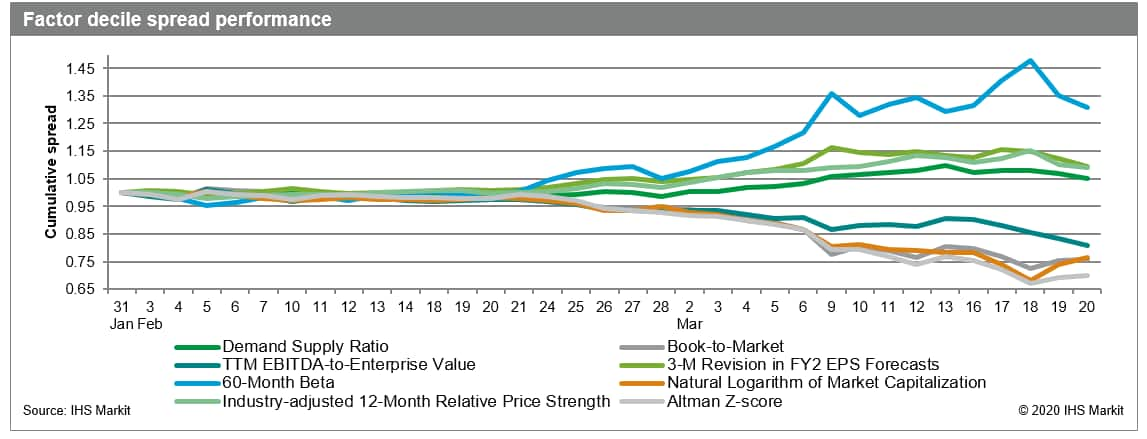
The final trading day of last week coincided with a quadruple witching day and, true to its historical tendency of heightened volatility, US stocks finished in negative territory, capping their worst week since the peak of the financial crisis. We have closely monitored and reported on daily factor and style model performance in light of the continued significant day-to-day swings in market returns amid the growing coronavirus panic, typified at the start of the week by the highest close on record for the CBOE Volatility Index (VIX), commonly referred to as the Wall Street fear index. Extending on last week's publication, in this special report we continue our weekly performance review of daily style exposures in the US, as well as month-to-date results from non-US regions.
- Since January, low beta and high bankruptcy risk remained the best and weakest signals cumulatively in US markets, while high momentum stocks and the least shorted shares saw renewed weakness last week
- Our Historical Growth Model expanded its lead over other models as the only style to remain in positive territory cumulatively since January, while Price Momentum remained the weakest performer, giving up the most ground last week
- In Developed Europe, Developed Pacific and emerging markets, low beta significantly outperformed other styles, while noticeably negative signals included high bankruptcy risk and small caps in developed markets and low valuation in emerging markets
Figure 1

S&P Global provides industry-leading data, software and technology platforms and managed services to tackle some of the most difficult challenges in financial markets. We help our customers better understand complicated markets, reduce risk, operate more efficiently and comply with financial regulation.
This article was published by S&P Global Market Intelligence and not by S&P Global Ratings, which is a separately managed division of S&P Global.
{"items" : [
{"name":"share","enabled":true,"desc":"<strong>Share</strong>","mobdesc":"Share","options":[ {"name":"facebook","url":"https://www.facebook.com/sharer.php?u=http%3a%2f%2fssl.ihsmarkit.com%2fmarketintelligence%2fen%2fmi%2fresearch-analysis%2fhistoric-coronavirus-fear-index.html","enabled":true},{"name":"twitter","url":"https://twitter.com/intent/tweet?url=http%3a%2f%2fssl.ihsmarkit.com%2fmarketintelligence%2fen%2fmi%2fresearch-analysis%2fhistoric-coronavirus-fear-index.html&text=Historic+coronavirus+fear+index+%7c+S%26P+Global+","enabled":true},{"name":"linkedin","url":"https://www.linkedin.com/sharing/share-offsite/?url=http%3a%2f%2fssl.ihsmarkit.com%2fmarketintelligence%2fen%2fmi%2fresearch-analysis%2fhistoric-coronavirus-fear-index.html","enabled":true},{"name":"email","url":"?subject=Historic coronavirus fear index | S&P Global &body=http%3a%2f%2fssl.ihsmarkit.com%2fmarketintelligence%2fen%2fmi%2fresearch-analysis%2fhistoric-coronavirus-fear-index.html","enabled":true},{"name":"whatsapp","url":"https://api.whatsapp.com/send?text=Historic+coronavirus+fear+index+%7c+S%26P+Global+ http%3a%2f%2fssl.ihsmarkit.com%2fmarketintelligence%2fen%2fmi%2fresearch-analysis%2fhistoric-coronavirus-fear-index.html","enabled":true}]}, {"name":"rtt","enabled":true,"mobdesc":"Top"}
]}


