Customer Logins
Obtain the data you need to make the most informed decisions by accessing our extensive portfolio of information, analytics, and expertise. Sign in to the product or service center of your choice.
Customer Logins
EQUITIES COMMENTARY
Jul 26, 2021
Cryptocurrency signals: Bitcoin pricing factors
Research Signals - July 2021
Bitcoin (BTC), the first and most popular cryptocurrency, was created in 2009 to function as money in the form of a peer-to-peer digital payment system. While it is a long way from widespread acceptance as an alternative to other fiat currencies, Bitcoin has experienced an uptick in recognition from high profile corporations and investment firms in addition to its recent acceptance in El Salvador as an alternative legal tender to the US dollar.
With the increased interest in cryptocurrencies from financial institutions and investors, we study interactions between the price of Bitcoin and cryptocurrency signals, namely macroeconomic indicators and factor signals.
- Since January 2014, Bitcoin has traded relatively independent
of the US dollar, US 10 year treasury yields and consumer price
index (CPI), contradicting expectations for its use as a competitor
to other stores of value and hedge against inflation.
- The level of risk appetite in equity markets has been more
influential on Bitcoin pricing, particularly given the rise in
retail investors since 2020, as confirmed by a positive correlation
with high beta stocks.
- Changes in market dynamics since 2020, particularly with respect to the rapid rise in equity retail traders and meme stocks, has increased the relationship between the performance of Bitcoin and signals of high trading volume and heavily shorted stocks.
Background and historical pricing of Bitcoin
A recent IHS Markit report discusses the conceptual foundation for cryptocurrencies with F.A. Hayek's 1976 studies on Choice in Currency and Denationalization of Money, written during a time of double-digit inflation in most advanced economies. He argued for competition among citizen's choice of currency issued by their or other governments, allowing users to store wealth in instruments least subject to inflationary debasement. Cryptocurrencies are an extension of his concept of removing the control of the supply of money from national governments.
The specific concept for Bitcoin was introduced in October 2008 and the first Bitcoin block was mined on 3 January 2009. Since that time, thousands of other cryptocurrencies have sprung up (5,951 with a combined market cap of USD1.4 trillion as of 28 June 2021, according to investing.com), with Ethereum the most successful competitor; however, digital currencies are still considered novel, with Bitcoin remaining the dominant player which we focus on in this report. At the time of writing this report, Bitcoin continues to make up for more than 45% of the total cryptocurrency market cap, according to CoinMarketCap.com.
Bitcoin is a peer-to-peer digital payment system in which transactions are recorded on the Bitcoin network's public ledger, known as the blockchain. However, unlike other financial payment systems, it operates independent of banks or governments and, instead, transactions are verified on this decentralized network of computers.
Given the purely digital nature of Bitcoin and its speculative and potentially nefarious use, its validity has been questioned by many well-known sceptics, including a famous rebuke from JPMorgan CEO Jamie Dimon. Among the many obstacles hindering Bitcoin's widespread acceptance are the risks associated with increasing government regulations, as seen recently in South Korea and China, but perhaps most importantly its price volatility.
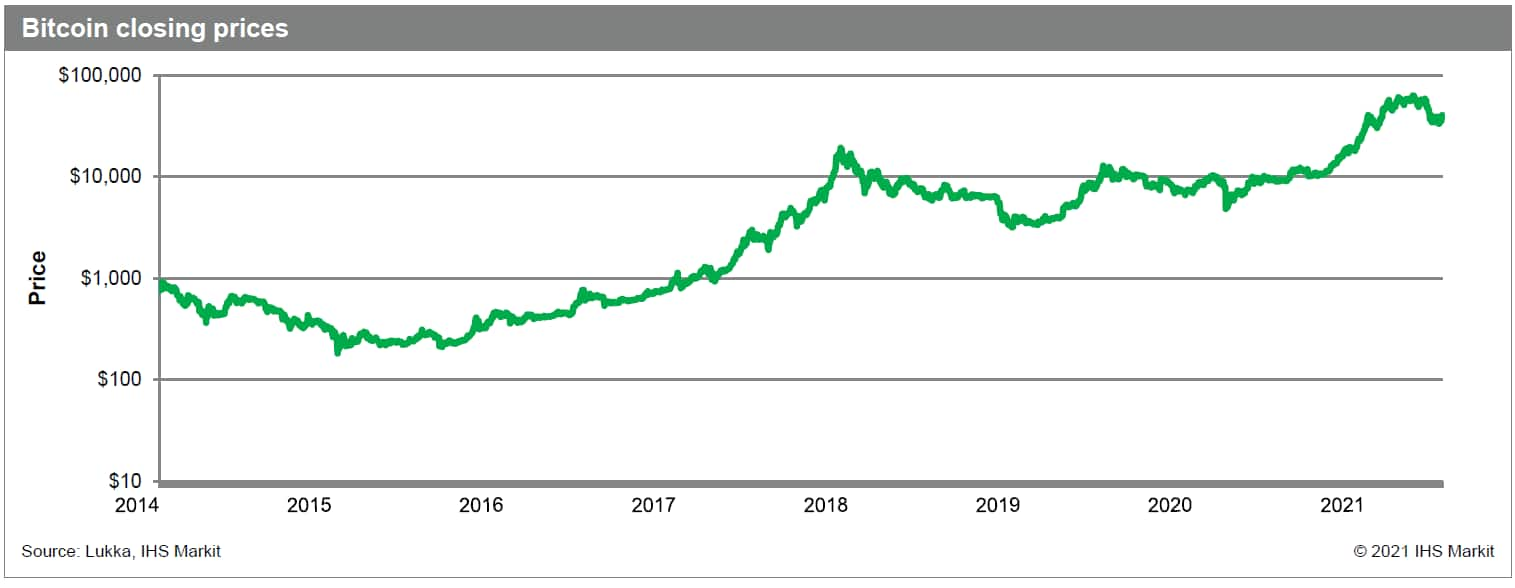
A plot of Bitcoin's price (Figure 1) during its more established years (since January 2014 as sourced from the Lukka Prime product[1]) captures the ensuing fluctuation in price resulting from the highly speculative nature of Bitcoin trading. Initially, mining Bitcoin was the easiest and most cost-effective way to own Bitcoin. However, with increasing popularity as an alternative investment asset, the 'cost of mining' increased and trading Bitcoins on an exchange became more lucrative.
This was also fueled by new exchanges such as Coinbase propping up. Coinbase launched in 2012 but saw an exponential increase in trading volume in late 2017. Indeed, we plot the data on a log scale given several episodes of meteoric increases and bubble bursts over the period. In particular, we highlight a handful of notable price slides including the 84.5% decline from the 5 December 2013 near term high to the 14 January 2015 trough, the 83.4% plunge from the cryptocurrency rush which peaked on 16 December 2017 through 15 December 2018 and the recent 47.3% bubble burst from the 13 April 2021 all-time high through 8 June 2021.
Figure 1
With this background, in the following sections we investigate the relationship between Bitcoin pricing and other external cryptocurrency signals including the macroeconomic setting and investor sentiment captured by equity and securities lending market signals.
[1] The price data from Lukka is aggregated from multiple exchanges and is a 'Fair Market Value'
Macroeconomic indicators of Bitcoin prices and demand
First, crypto signals from a macroeconomic perspective, we analyze Bitcoin daily returns with that of changes in other stores of value including the US dollar, gold, US Treasuries and oil, along with inflation (CPI) and US equity market sentiment measured by the VIX and the S&P 500 and QQQ indexes. Note that we use proxies for gold, the S&P 500 and QQQ gauged by the SPDR Gold Shares ETF (GLD), the SPDR S&P 500 ETF (SPY) and the Invesco QQQ Trust ETF (QQQ), respectively, sourced from the IHS Markit ETF Analytics database.
We report correlations over our full history of Bitcoin pricing as well as since the start of 2020 to provide more focus on what may be considered the most speculative period for Bitcoin pricing which coincided with the rise in equity retail traders driven in part by brokerage firms' move to offer free trades, the ensuant upsurge in meme stocks, including the frenzied trading in GameStop and other heavily shorted stocks in January 2021, and the elevated level of SPAC issuance. Table 1 summarizes the results (correlations with CPI are based on monthly data given its reporting frequency).
Table 1

Theoretically, if Bitcoin acts as an alternative to owning other stores of value, then an increase in demand for Bitcoin would imply a decrease in demand for the US dollar, gold, US Treasuries and oil. In turn, we would expect a negative correlation in price changes of Bitcoin and the US dollar, gold and oil and a positive correlation with US Treasury yields (a decrease in bond price corresponds to an increase in yield). Furthermore, Bitcoin could also be considered a hedge against loose monetary policy, reflected in an inflation-driven rise in US 10 year Treasury yields and a falling US dollar.
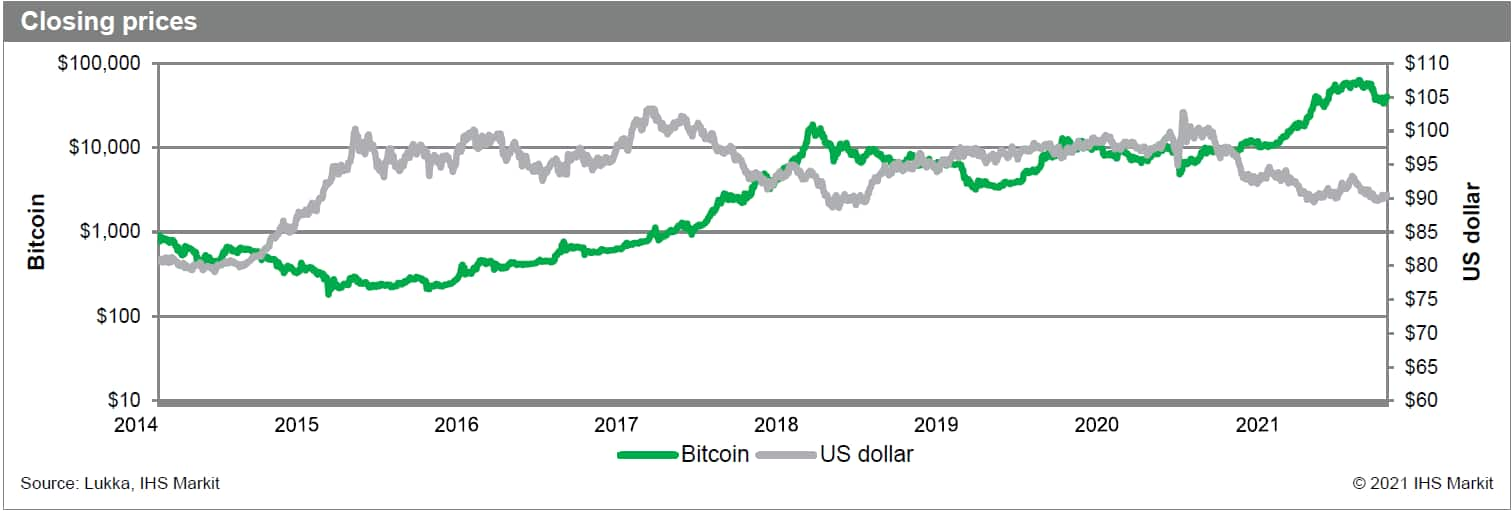
However, since 2013, correlations have been relatively neutral with the US dollar (-0.01), the US 10 year Treasury yield (0.03) and oil prices (0.03), implying that Bitcoin has acted as an asset class of its own over this period. We do note, though, the anticipated negative correlation with changes in the US dollar (Figure 2) has increased in magnitude to some extent since 2020 (-0.07) and may develop further over time.
Figure 2
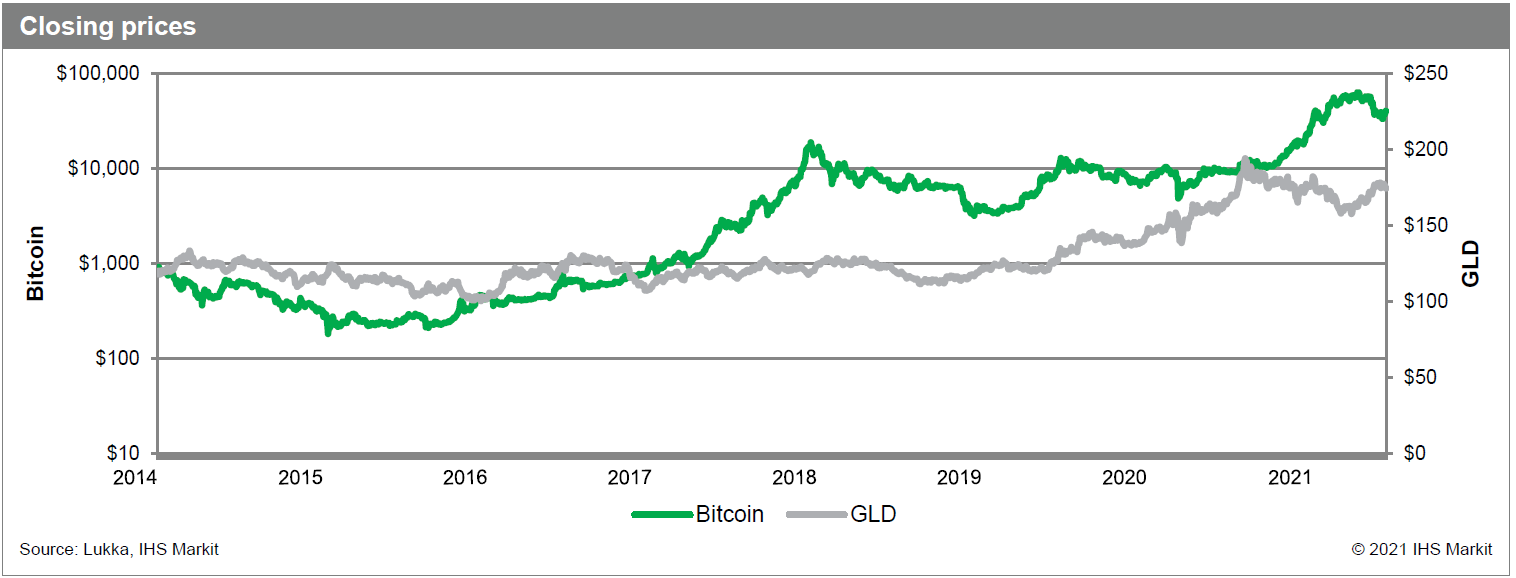
Interestingly, one of the highest correlations with the economic macro indicators was with gold (0.10). What is more, this relationship (0.25) increased precipitously since 2020 (Figure 3); however, this may have been more of a coincident event involving the increase in retail traders' interest in Bitcoin at the same time that investors bid up the price of gold as a hedge against inflation and currency devaluation in the wake of extreme monetary easing globally by central banks to combat the COVID-19 induced recessionary environment. Indeed, since the start of 2021, the correlation with gold is -0.01.
Figure 3
For inflation, we report a 0.13 correlation between monthly changes in Bitcoin prices and CPI since January 2014. However, we remark that, due to the monthly frequency of the observations, the resulting reduced sample size (92 monthly versus 1877 daily observations), compounded by the increased magnitude in Bitcoin returns (max monthly: 122%; max daily: 0.26%) made the correlation statistic more susceptible to outlier effects. In fact, by removing the two extreme monthly returns in excess of 100%, we report a 50% reduction in correlation at just 0.065.
We also draw attention to the correlation's unexpected shift into negative territory since 2020 (-0.12). Thus, while Bitcoin has been effective in providing general diversification, fund managers that may have used it as a hedge against inflation and the US dollar may not have seen the results that they anticipated, as wild price fluctuations due to other external factors undermined its effectiveness in achieving this objective.
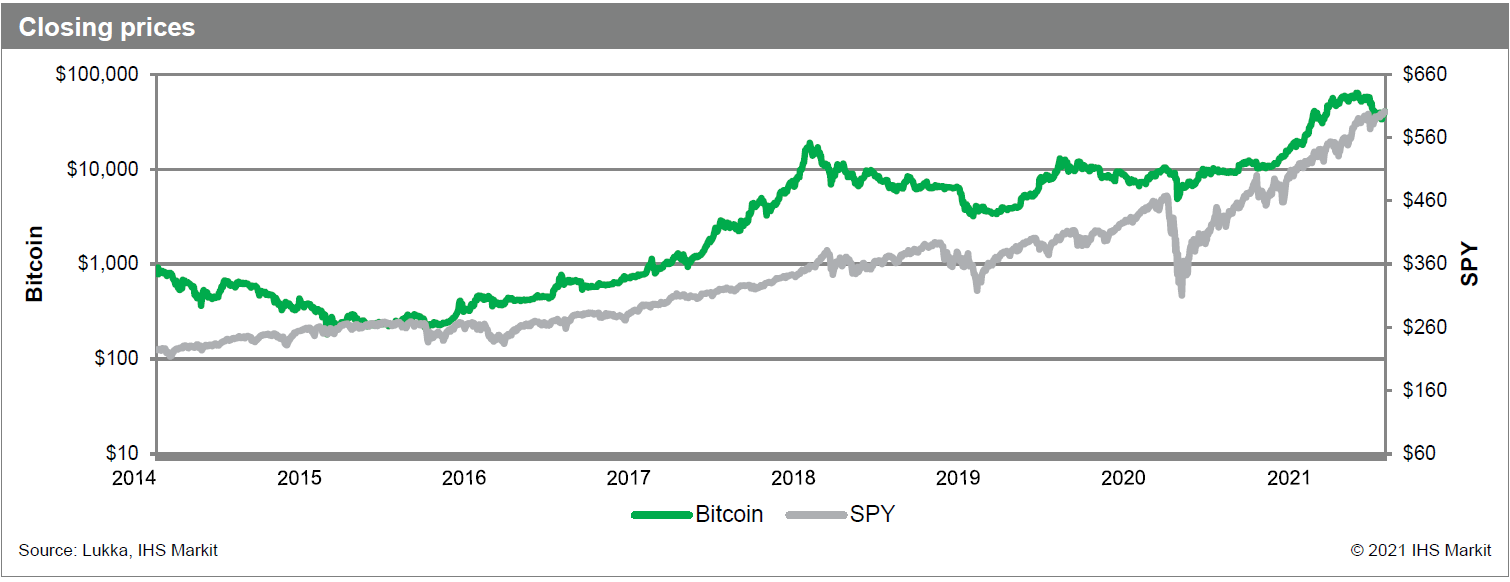
Turning to equity markets, we observe somewhat higher correlations in daily returns between Bitcoin and the S&P 500 (0.14) since January 2014, with a much stronger relationship (0.38) since 2020 (Figure 4), as stocks and Bitcoin continued on their paths to all-time highs following the drawdown at the onset of the pandemic. The implication is that Bitcoin acts as a risk-on asset whose returns tend to move in tandem with investors' risk appetite (also associated with selling of safe haven US Treasury 10 year notes). However, as a speculative trade, we would expect higher correlations with high-growth stocks embodied by QQQ, yet we find correlations of similar magnitude with the S&P 500 in both time periods analyzed.
Figure 4
Lastly, changes in VIX have seen correlations with Bitcoin daily returns at -0.10 since January 2014 and -0.33 since 2020. This perhaps unexpected inverse relationship may be more of a factor of the depressed level of volatility in the equity markets witnessed during the analysis period but is in line with increased positive correlation to SPY, as investors treat Bitcoin as a risk asset.
While the original hypothesis of Bitcoin acting as an alternative to owning other stores of value may have some relationship with the direction of Bitcoin demand and pricing, for now, the risk-on trade seems to be the most impactful Bitcoin signal. At the least, fairly low correlation to traditional assets continues to attract the attention of investors seeking diversification benefits.
Investor sentiment and Bitcoin signal
Institutional investor interest in cryptocurrencies continues to increase, with 70% of institutional investors expecting to invest in this asset class, according to a Fidelity survey. With this in mind, we study the relationship between Bitcoin daily returns and equity factors from our Research Signals factor library, covering a broad spectrum of value, quality, growth, risk, momentum and short sentiment measures.
Daily factor returns are based on decile return spreads, where the spread is computed as the difference in the equal-weighted return at the top (decile 1) and bottom (decile 10) tails. The universe is our US Total Cap universe, which consists of approximately 3,000 of the largest cap names. Again, we report correlations over our full history of Bitcoin pricing as well as during the more speculative period starting in 2020 (Table 2).
Table 2
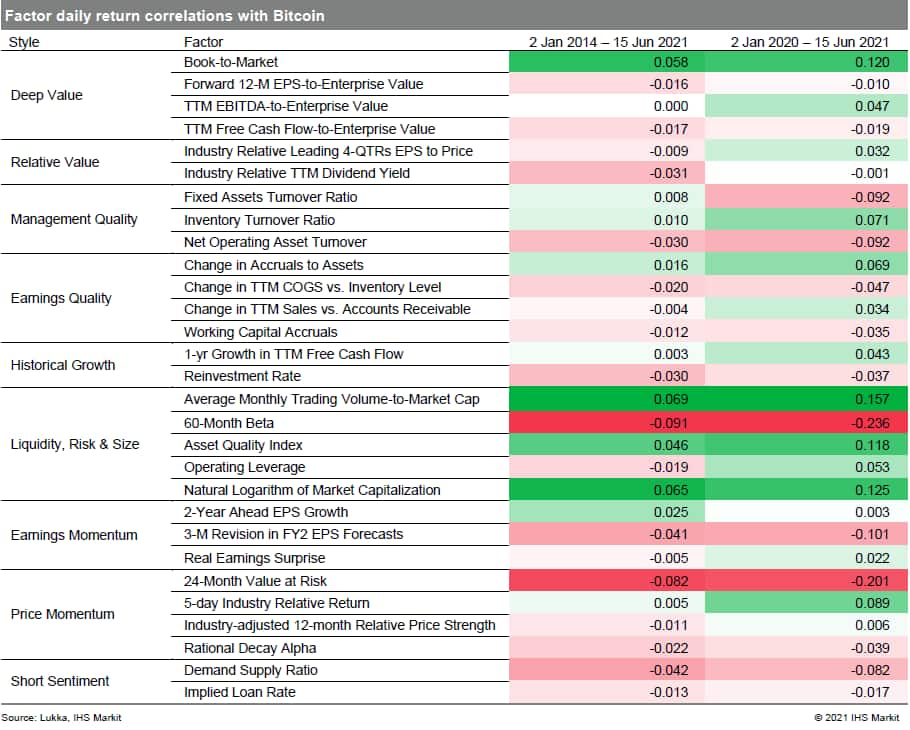
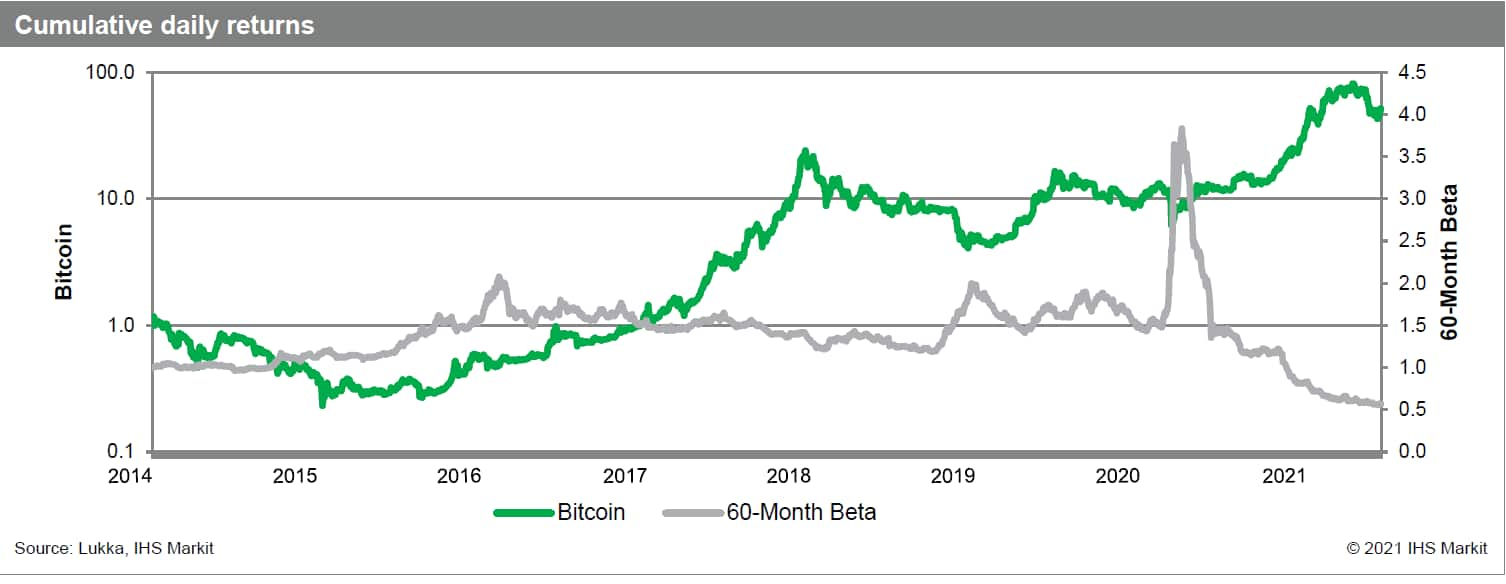
Over the full period, some patterns with Bitcoin returns that stand out include the relatively high negative correlation with 60-Month Beta (-0.091). We remark that 60-Month Beta is ranked to favor low beta, thus a negative correlation indicates that days in which Bitcoin underperforms tend to be associated with outperformance of low risk names.
The implication is that a more risk averse stock market has a higher relationship with negative Bitcoin price movement, suggestive of the speculative nature of Bitcoin trading. Reinforcing this point further, the magnitude of the correlation increased significantly since 2020 (-0.236) as investors' increasing risk appetite powered a robust market recovery from the initial stages of the pandemic, coinciding with the strong run in Bitcoin pricing (Figure 5).
Similar observations are also found with 24-Month Value at Risk in both its full period (-0.082) and more recent (-0.201) correlations, and to a lesser degree with 5-day Industry Relative Return, a price reversal metric capturing stocks poised for a short term snapback, which experienced a meaningful increase in its recent co-movement with Bitcoin returns (0.089) compared with the neutral longer term result (0.005). This crypto signal may potentially be a sign of a higher prevalence of bullish short term traders in the market 'buying the dips.'
Figure 5
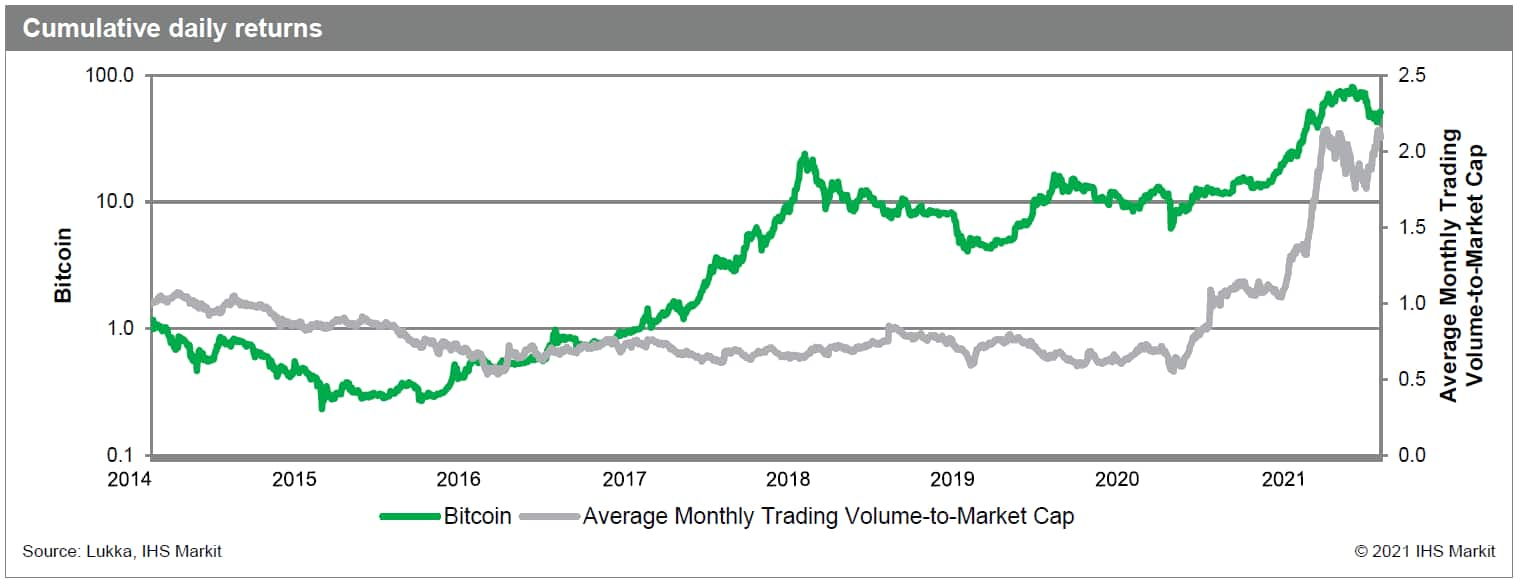
We also draw attention to Average Monthly Trading Volume-to-Market Cap (Figure 6), which had a moderate correlation (0.069) with Bitcoin returns over the full period. However, since 2020 this relationship has ticked up to 0.157 at the same time as the rapid rise in equity retail traders sent shock waves through the market, drawing controversy to their potential influence on stock prices and market dynamics.
Figure 6
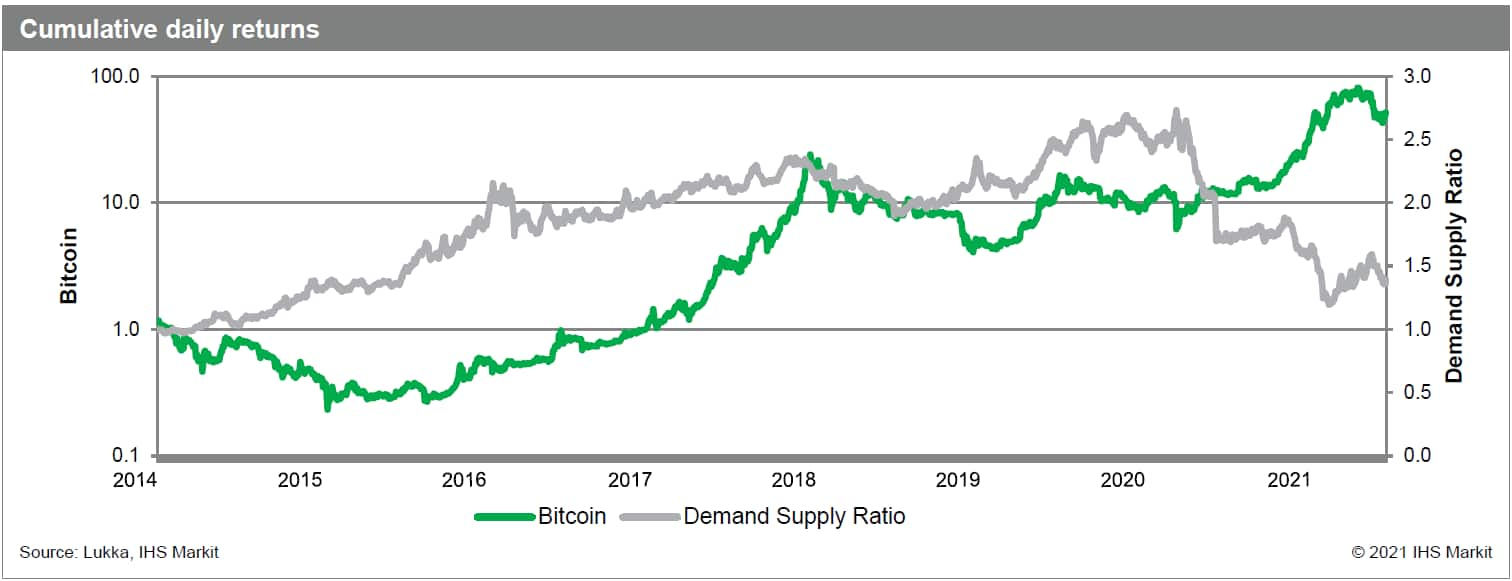
Lastly, on a related note, we find a modestly negative correlation between Bitcoin price movements and Demand Supply Ratio performance (-0.042) which turned more negative (-0.082) since 2020 (Figure 7). Demand Supply Ratio is a proprietary measure of the daily aggregate amount of stock borrowed in the market relative to the lendable inventory, a proxy for short interest level providing more timely updates over US exchange-based data which is reported only twice per month.
As a Short Sentiment measure, Demand Supply Ratio performance got caught up in the frenzied trading in heavily shorted stocks in January 2021. While the upsurge in meme stocks, fueled by online investing communities such as Reddit investors, remains impactful on markets, daily monitoring may continue to reveal exposures to investments in the most shorted stocks that coincide with the hype in Bitcoin.
Figure 7
In summary, while cryptocurrencies, and Bitcoin in particular, are a long way from global acceptance, they continue to gain validity and may one day become more mainstream. In the meantime, Bitcoin trading has been highly speculative and volatile, with pricing linked more so to the overall mood of equity markets, rather than to other stores of value such as the US dollar and US 10 year treasury yields.
Further examination of its returns compared with performance across a comprehensive list of signals also suggests a high correlation with high beta stocks and more recently with high trading volume and heavily shorted stocks given the rise in the retail investment community. However, given the lack of fundamental analysis that can be applied to cryptocurrencies, perhaps as they gain more traction in the investment community and move out of the realm of speculative trading, macro factors may have greater sway on the crypto trading market.
S&P Global provides industry-leading data, software and technology platforms and managed services to tackle some of the most difficult challenges in financial markets. We help our customers better understand complicated markets, reduce risk, operate more efficiently and comply with financial regulation.
This article was published by S&P Global Market Intelligence and not by S&P Global Ratings, which is a separately managed division of S&P Global.
{"items" : [
{"name":"share","enabled":true,"desc":"<strong>Share</strong>","mobdesc":"Share","options":[ {"name":"facebook","url":"https://www.facebook.com/sharer.php?u=http%3a%2f%2fssl.ihsmarkit.com%2fmarketintelligence%2fen%2fmi%2fresearch-analysis%2fcryptocurrency-signal-bitcoin-pricing-factors.html","enabled":true},{"name":"twitter","url":"https://twitter.com/intent/tweet?url=http%3a%2f%2fssl.ihsmarkit.com%2fmarketintelligence%2fen%2fmi%2fresearch-analysis%2fcryptocurrency-signal-bitcoin-pricing-factors.html&text=Cryptocurrency+signals%3a+Bitcoin+pricing+factors++%7c+S%26P+Global+","enabled":true},{"name":"linkedin","url":"https://www.linkedin.com/sharing/share-offsite/?url=http%3a%2f%2fssl.ihsmarkit.com%2fmarketintelligence%2fen%2fmi%2fresearch-analysis%2fcryptocurrency-signal-bitcoin-pricing-factors.html","enabled":true},{"name":"email","url":"?subject=Cryptocurrency signals: Bitcoin pricing factors | S&P Global &body=http%3a%2f%2fssl.ihsmarkit.com%2fmarketintelligence%2fen%2fmi%2fresearch-analysis%2fcryptocurrency-signal-bitcoin-pricing-factors.html","enabled":true},{"name":"whatsapp","url":"https://api.whatsapp.com/send?text=Cryptocurrency+signals%3a+Bitcoin+pricing+factors++%7c+S%26P+Global+ http%3a%2f%2fssl.ihsmarkit.com%2fmarketintelligence%2fen%2fmi%2fresearch-analysis%2fcryptocurrency-signal-bitcoin-pricing-factors.html","enabled":true}]}, {"name":"rtt","enabled":true,"mobdesc":"Top"}
]}


