Customer Logins
Obtain the data you need to make the most informed decisions by accessing our extensive portfolio of information, analytics, and expertise. Sign in to the product or service center of your choice.
Customer Logins
BLOG
May 01, 2020
COVID-19 dispersion leads EBA to Change Prudent Valuation
European banks haven't always welcomed regulatory change since the Great Financial Crisis. More often than not it raises costs and can have a material impact on balance sheet structure; the reduction in risk weighted assets being a notable example. But regulators have a responsibility to ensure the stability of individual banks and the financial system as a whole. The interests of banks and wider society should be aligned as much as possible.
Yet we are in strange times, and the advent of a terrible pandemic shows that regulators can take prudential measures that support - rather than punish - banks. A slew of actions, ranging from softening the leverage ratio to a more flexible approach to IFRS 9, are aimed at helping banks perform their fundamental intermediary role - lending to consumers and businesses.
One such measure relates to Prudent Valuation, an EU regulation that has been in force since 2016. This requires banks to calculate Additional Valuation Adjustments (AVAs) on fair valued instruments, which are accretive and result in Prudent Valuation Adjustments (PVAs). In other words, the AVA is the difference between fair value and prudent value, leading to deductions from core equity tier one capital (CET1). Essentially, Prudent Valuation introduces an extra layer of conservatism to valuation: after the AVAs there should be 90% confidence in exiting the position at the adjusted level.
This all seems relatively uncontroversial and in keeping with prudential regulation post-GFC. Yet the EBA felt that it was necessary to make changes to the regulatory technical standard (RTS) on April 22. Specifically, under the core approach for Prudent Valuation (used by larger banks), the aggregation factor of 50% defined in the RTS was increased by the EBA to 66%. The aggregation factor allows for diversification due to overlap of individual AVAs when they are aggregated at the category level. An increase in the factor will reduce the overall AVA.
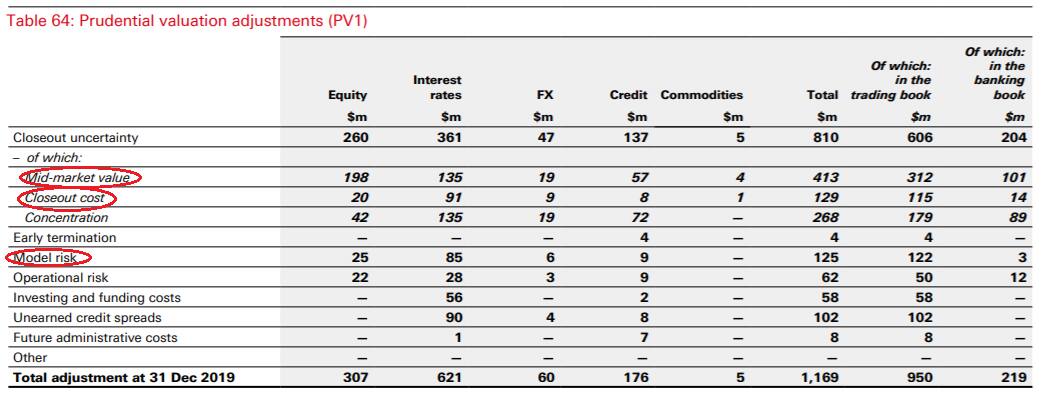
This applies to three of the nine AVAs: Market Price Uncertainty; Close Out Cost and Model Risk. Figure 1. shows HSBC's Prudent Valuation Adjustments, as published in the Pillar 3 disclosures for 2019 (this is purely for illustrative purposes - all banks covered under the regulation publish similar documents). The total of the mid-market adjustments (market price uncertainty) is by far the largest and this is typically seen in all banks.

Fig.1 Example of bank Prudent Valuation reporting (source: HSBC)
So it is clear that the amendments made by the EBA will have a material effect. The justification for this is the "extreme volatility" seen during the recent stressed period has resulted in the regulation having an "excessive procyclical impact". The transmission mechanism is dispersion among market prices for instruments, which is largely what market price uncertainty and close out costs reflect.
There is little doubt that during this crisis weak liquidity and uncertainty, amplified by technical factors, have resulted in fractured markets and impaired price formation. The evidence of this heightened dispersion is apparent in the data.
Figure 2 is taken from IHS Markit's Price Viewer platform. It shows dispersion of contributions that form the composite CDS curve for Glencore International (April 28). Note that this is a highly liquid constituent of the Markit iTraxx Europe and the dispersion measured is of contributions that pass stringent data quality tests.

Fig. 2 Prudent Valuation metrics for Glencore CDS (source: IHS Markit Price Viewer)
The chart shows standard deviations and 10th/90th percentiles; both metrics are commonly used to calculate MPU and close out cost. It shows that dispersion is significantly higher at the short- and long-end compared to the "belly" of the curve. The 5-year is by far the most liquid tenor in CDS, so a tighter distribution of contributions is expected. But the large dispersion at either end of the curve is materially larger than "normal" for an IG name like Glencore and the 5-year hasn't escaped either - at January month-end the standard deviation was 2, not 4.
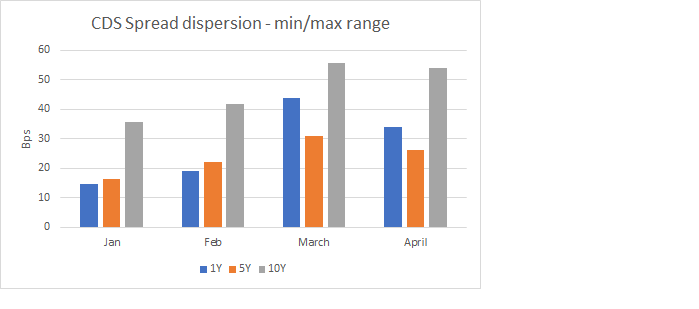
The increase in dispersion due to the crisis is underlined by figure 3. It shows the average range between minimum and maximum CDS contributions for 2020 month-ends (we have taken a pre-month-end snapshot for April).

Fig. 3 CDS spread dispersion has increased since the beginning of the year (source: IHS Markit)
The chart provides ample evidence that there has been a considerable rise in dispersion, particularly at March month-end (Prudent Valuation is reported quarterly). The five-year dispersion has risen but the increase is more dramatic at the short-end and long-end (as we saw with Glencore). It also demonstrates that dispersion has remained stubbornly high, despite the rally in April.
The uncertainty pervading the market is also reflected in the bid-ask spread (fig.4), which is a component of the close out cost calculation. Taking the Glencore example again, we see that up until March it traded with a relatively constant bid-ask spread of about 8bps. This ballooned to over 50bps at the peak of the crisis but has since settled around 30bps - still highly elevated for this name.

Figure 4. Bid/ask spread for Glencore 5-year CDS (source: IHS Markit Price Viewer)
Similar patterns are observed in other asset classes, both cash and synthetic. Given the clear evidence of unusually high levels of dispersion and the potential implications for lending provision, the EBA's pragmatic approach to Prudent Valuation is understandable. It is also a timely reminder that access to detailed, instrument level dispersion data is crucial for banks. Regulators will require increased transparency to AVA calculations, during this crisis and when we emerge in the aftermath.
IHS Markit provides metrics for Prudent Valuation across several asset classes, including CDS, bonds and derivatives. Please contact Sales@ihsmarkit.com for further details.
Related Webinar on Demand
Global Market Liquidity and Covid-19: Impact of the Fed and ECB's Response
S&P Global provides industry-leading data, software and technology platforms and managed services to tackle some of the most difficult challenges in financial markets. We help our customers better understand complicated markets, reduce risk, operate more efficiently and comply with financial regulation.
This article was published by S&P Global Market Intelligence and not by S&P Global Ratings, which is a separately managed division of S&P Global.
{"items" : [
{"name":"share","enabled":true,"desc":"<strong>Share</strong>","mobdesc":"Share","options":[ {"name":"facebook","url":"https://www.facebook.com/sharer.php?u=http%3a%2f%2fssl.ihsmarkit.com%2fmarketintelligence%2fen%2fmi%2fresearch-analysis%2fcovid19-dispersion-leads-eba-to-change-prudent-valuation.html","enabled":true},{"name":"twitter","url":"https://twitter.com/intent/tweet?url=http%3a%2f%2fssl.ihsmarkit.com%2fmarketintelligence%2fen%2fmi%2fresearch-analysis%2fcovid19-dispersion-leads-eba-to-change-prudent-valuation.html&text=COVID-19+dispersion+leads+EBA+to+Change+Prudent+Valuation+%7c+S%26P+Global+","enabled":true},{"name":"linkedin","url":"https://www.linkedin.com/sharing/share-offsite/?url=http%3a%2f%2fssl.ihsmarkit.com%2fmarketintelligence%2fen%2fmi%2fresearch-analysis%2fcovid19-dispersion-leads-eba-to-change-prudent-valuation.html","enabled":true},{"name":"email","url":"?subject=COVID-19 dispersion leads EBA to Change Prudent Valuation | S&P Global &body=http%3a%2f%2fssl.ihsmarkit.com%2fmarketintelligence%2fen%2fmi%2fresearch-analysis%2fcovid19-dispersion-leads-eba-to-change-prudent-valuation.html","enabled":true},{"name":"whatsapp","url":"https://api.whatsapp.com/send?text=COVID-19+dispersion+leads+EBA+to+Change+Prudent+Valuation+%7c+S%26P+Global+ http%3a%2f%2fssl.ihsmarkit.com%2fmarketintelligence%2fen%2fmi%2fresearch-analysis%2fcovid19-dispersion-leads-eba-to-change-prudent-valuation.html","enabled":true}]}, {"name":"rtt","enabled":true,"mobdesc":"Top"}
]}


