Customer Logins
Obtain the data you need to make the most informed decisions by accessing our extensive portfolio of information, analytics, and expertise. Sign in to the product or service center of your choice.
Customer Logins
EQUITIES COMMENTARY
Jul 07, 2016
Equity ETF inflows grind to a halt
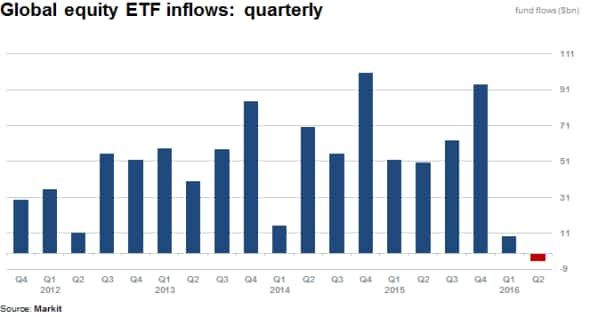
Half way through 2016, net inflows into global equity ETFs are tracking for the worst annual inflow in almost fifteen years as market jitters and increased volatility see the asset class experience the worst two consecutive quarterly outflows seen in over five years.
- Global equity ETFs record first quarterly outflow since January 2010
- American and European equity ETFs lose over $9.2bn of funds in first two quarters of 2016
- Investors drawn to minimum volatility funds which gather $8bn in first half of 2016
Drought of inflows for equity ETFs
Global inflows into equity exposed ETF products are currently on track for smallest net annual inflow in over fifteen years after posting the first quarterly outflow seen in five years in the second quarter of 2016.

While still early into the third quarter of 2016, inflows into equity ETFs have moved into positive territory but ETF AUM growth has stalled in the past three years with continued stagnation in overall flows, driven by volatile markets and weary investors.
All regions witness volatile inflows
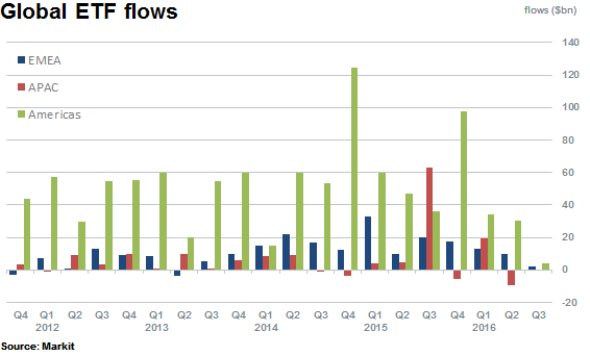
Net inflows have stalled dramatically across all three major listing geographies globally. EMEA, the Americas and Apac have all seen a so far negligible recovery in inflows during July after consecutive quarters where average inflows have been significantly higher in previous years. EMEA and American based equity ETFs on aggregate have seen year to date outflows with strong Apac inflows recorded in the first quarter of the year, close to $20bn. However, in the second quarter Apac flows reversed, with more than $5bn of outflows recorded. This outflow is largely responsible for the net global outflow reported in the quarter.

On net basis year to date, global equity fund inflows are still positive at $9.1bn. For context, global equity ETFs have only been able to attract funds representing 0.7% of current AUM (currently near $1.26 trillion.)
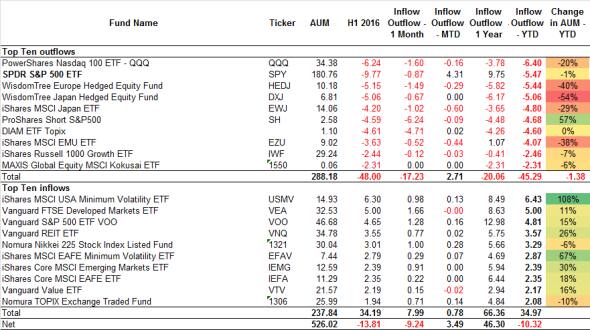
The top ten funds by flows, which represent almost a third of AUM highlight funds which have attracted investors and likewise which funds have become unfavourable.

Two of the largest funds globally are featured, the SPDR S&P 500 (SPY) and the Vanguard S&P 500 ETF (VOO), both track the S&P 500 and have seen inflows of $4.6bn and outflows of $9.7bn respectively.
These contrasting flows for two different products tracking the same underlying assets could be attributed to the continued competition in ETF fees, with the almost 80% cheaper management fee currently charged by VOO explaining the direction of flows.
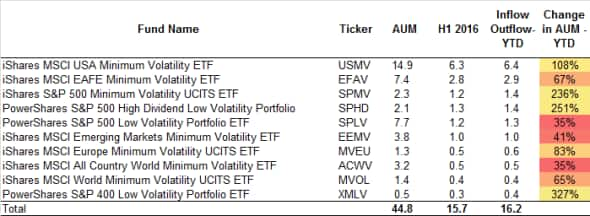
Most noticeably, funds able to attract significant inflows have been minimum volatility funds with the iShares MSCI USA Minimum Volatility ETF gathering a sizeable $6.3bn in the first half of 2016.
The top ten minimum-volatility themed ETFs globally, have managed to attract almost $16bn of inflows in the first two quarters of 2016 which has seen AUM swell to almost $45bn. Including minimum or low volatility funds that have seen outflows, $7.9bn of inflows were recorded in the first half of the year, with a further inflow of $3.9bn recorded thus far this month.

Relte Stephen Schutte | Analyst, Markit
Tel: +44 207 064 6447
relte.schutte@markit.com
S&P Global provides industry-leading data, software and technology platforms and managed services to tackle some of the most difficult challenges in financial markets. We help our customers better understand complicated markets, reduce risk, operate more efficiently and comply with financial regulation.
This article was published by S&P Global Market Intelligence and not by S&P Global Ratings, which is a separately managed division of S&P Global.
{"items" : [
{"name":"share","enabled":true,"desc":"<strong>Share</strong>","mobdesc":"Share","options":[ {"name":"facebook","url":"https://www.facebook.com/sharer.php?u=http%3a%2f%2fssl.ihsmarkit.com%2fmarketintelligence%2fen%2fmi%2fresearch-analysis%2f07072016-Equities-Equity-ETF-inflows-grind-to-a-halt.html","enabled":true},{"name":"twitter","url":"https://twitter.com/intent/tweet?url=http%3a%2f%2fssl.ihsmarkit.com%2fmarketintelligence%2fen%2fmi%2fresearch-analysis%2f07072016-Equities-Equity-ETF-inflows-grind-to-a-halt.html&text=Equity+ETF+inflows+grind+to+a+halt","enabled":true},{"name":"linkedin","url":"https://www.linkedin.com/sharing/share-offsite/?url=http%3a%2f%2fssl.ihsmarkit.com%2fmarketintelligence%2fen%2fmi%2fresearch-analysis%2f07072016-Equities-Equity-ETF-inflows-grind-to-a-halt.html","enabled":true},{"name":"email","url":"?subject=Equity ETF inflows grind to a halt&body=http%3a%2f%2fssl.ihsmarkit.com%2fmarketintelligence%2fen%2fmi%2fresearch-analysis%2f07072016-Equities-Equity-ETF-inflows-grind-to-a-halt.html","enabled":true},{"name":"whatsapp","url":"https://api.whatsapp.com/send?text=Equity+ETF+inflows+grind+to+a+halt http%3a%2f%2fssl.ihsmarkit.com%2fmarketintelligence%2fen%2fmi%2fresearch-analysis%2f07072016-Equities-Equity-ETF-inflows-grind-to-a-halt.html","enabled":true}]}, {"name":"rtt","enabled":true,"mobdesc":"Top"}
]}


