Customer Logins
Obtain the data you need to make the most informed decisions by accessing our extensive portfolio of information, analytics, and expertise. Sign in to the product or service center of your choice.
Customer Logins
BLOG
May 22, 2014
Well bore scale analysis helps unlock unconventional play potential
Detailed wellbore analysis of gamma ray log profiles can help identify high potential zones in unconventional resource plays that have large areal extents and rock type variability.
New US oil and gas production from tight rocks continues to set records and to reshape the world's energy portfolio. But today, recovery factors in the leading tight oil plays average only about 6-8 percent. Shale gas plays, while averaging better recoveries than tight oil, still are challenged by marginal economics at current Henry Hub prices. Understanding the most productive sweet spots and the potential to expand high well-productivity performance areas for the best economic recoveries is critical. In addition to sweet spots, understanding the distribution of all potential reservoir rocks in the subtle, but complex resource plays is critical to the future sustainability of these important new producers. Few of the newly established reservoir zones within existing unconventional plays such as the 1st, 2nd and 3rd Three Forks, Niobrara A,B and C and Wolfcamp A, B, C and D zones are identified in well and production records that are released to the public. This shortcoming of data makes it extremely difficult to evaluate well productivity, supply trends and value of these important producing assets in detail. Gamma ray log analysis can step in to help us fill in the data gaps.
The explorationist now focuses on pinpointing the best geological facies (a facies is a body of rock with specified geological characteristics) which offer potentially prospective reservoir zones within organically rich shale sections. Horizontal wellbores are geosteered into these specific porous zones. The wellbore is selectively fractured in stages, again targeting the best potential zones.
Ray log curves and analytic derivatives including: cross sections, indicators of organic richness and therefore hydrocarbon potential, facies changes in formation benches (a colloquial term for the facies changes that result in interbedded clastic and carbonate sections within the geological formation. These interbedded zones appear as "benches" on the logs.), are all especially valuable in understanding the anatomy of oil and gas resource plays that currently dominate North American E&P activity. Radioactivity in shale zones is measured by Gamma Ray logs and can be used to differentiate between prospective organic rich shale zones and more siliceous or calcareous zones interbedded with the shales that provide potential reservoir zones. Gamma Ray data packages allow users to understand the organic richness and distribution of source rocks and can also indicate potentially more porous non-shale zones that are critical to establish economic production within the wide areas that resource plays encompass. Gamma Ray logs are used to establish detailed, basin-wide correlations of facies over large areas and to identify the important reservoir zone details that are currently missing from publicly released information.


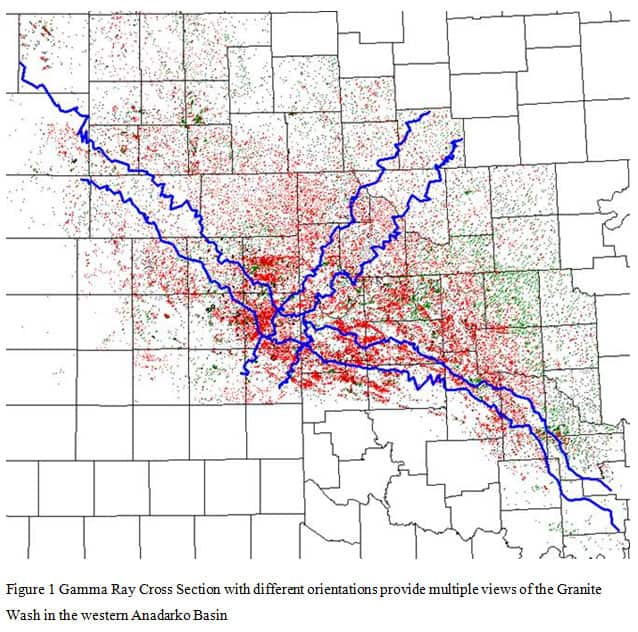
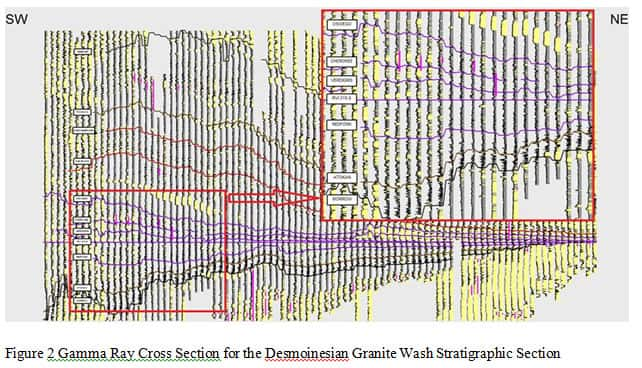
As the map in Figure 1 illustrates, it is important to create Gamma Ray cross sections in different orientations across a basin to understand the extent of individual plays, the lateral and horizontal facies variations and the potential flow characteristics. Figure 2 shows Gamma Ray cross section details for the Granite Wash, a prolific liquids play in the western Anadarko Basin with complex rock type changes and numerous bench zones within the prospective Granite Wash section. Each curve on the plot is a Gamma Ray log from an individual well. The gray areas within the Gamma Ray curves represent shale rich sequences and the yellow areas are sandstone or carbonate dominated sections. The Granite Wash benches are not all created equal as far as productivity is concerned. This view of the complex lithologic changes within the GraniteWash is a fine example of the small scale well bore specific data necessary to understand the play in its entirety.

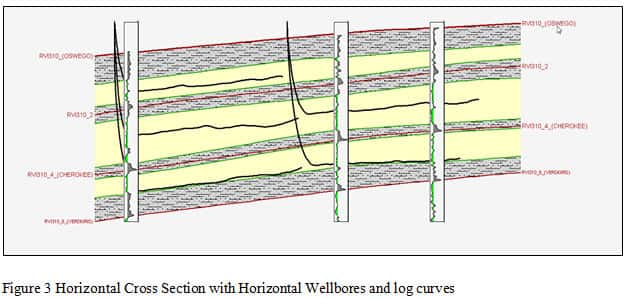
Figure 3 zooms into a closer look at the horizontal Granite Wash cross section with net sands (yellow) and net shales (gray) clearly visible. This view shows where the more porous reservoir zones are in relation to the distribution and geometry of the source rocks and includes the horizontal wellbores that have been drilled. Note how the horizontal wellbores were carefully geosteered within the reservoir zones.
Features & Benefits Summary
Standardized, spliced and normalized Gamma Ray curves provide net shale and non-shale volumes and distributions across large geographical areas but also at a very detailed level within parts of the play and even in individual wellbores. In the search for sweet spots, log curves can substitute for lack of geochemical data. The logs can be used to calculate a Total Organic Content (TOC) surrogate value and also to determine net hydrocarbon potential producing zones from the log parameters. Organic content can be identified in zones that have not been explored through drilling. This Gamma Ray framework saves time and allows the explorationist to focus on more high level details needed for wellbore planning, completion and production optimization.
From the log cross sections, geoscientists and engineers can create isopach and structure contour maps of unique horizons, mapping and analyzing those zones, seeing where similar productive zones may exist, and importantly, where they are not present in a basin. The Gamma Ray rock characteristics correlations are then integrated with well completion information and production data to create a clear picture for the targeted zones and their facies changes across a play and a basin. Well information with horizontal lateral lengths and wellbore orientation plus staged hydraulic fracturing particulars help establish the best practices for drilling and completion for the best well productivity. Peak production bubble maps close the loop with defined "most productive" areas clearly delineated.
Note: IHS Inc. and Reservoir Visualization, Inc. (RVI) are now offering a package of digital gamma ray logs with detailed lithologic correlations that can be used to generate comprehensive stratigraphic frameworks and subsurface models for key US oil and gas provinces. RVI's digital packages when combined with IHS well and production data and software tools like Petra and Kingdom provide powerful capabilities to analyze and visualize geological processes and relationships of petroleum systems and reservoirs at basin, play and reservoir levels.
Reservoir Visualization, Inc. (RVI) is headquartered in Ridgeway, Pennsylvania and is a consultancy specializing in the creation of stratigraphic correlation and visualization frameworks for oil and gas prospecting.
Posted 22 May 2014
This article was published by S&P Global Commodity Insights and not by S&P Global Ratings, which is a separately managed division of S&P Global.
{"items" : [
{"name":"share","enabled":true,"desc":"<strong>Share</strong>","mobdesc":"Share","options":[ {"name":"facebook","url":"https://www.facebook.com/sharer.php?u=http%3a%2f%2fssl.ihsmarkit.com%2fcommodityinsights%2fen%2fci%2fresearch-analysis%2fwell-bore-scale-analysis-helps-unlock-unconventional-play-potential.html","enabled":true},{"name":"twitter","url":"https://twitter.com/intent/tweet?url=http%3a%2f%2fssl.ihsmarkit.com%2fcommodityinsights%2fen%2fci%2fresearch-analysis%2fwell-bore-scale-analysis-helps-unlock-unconventional-play-potential.html&text=Well+bore+scale+analysis+helps+unlock+unconventional+play+potential","enabled":true},{"name":"linkedin","url":"https://www.linkedin.com/sharing/share-offsite/?url=http%3a%2f%2fssl.ihsmarkit.com%2fcommodityinsights%2fen%2fci%2fresearch-analysis%2fwell-bore-scale-analysis-helps-unlock-unconventional-play-potential.html","enabled":true},{"name":"email","url":"?subject=Well bore scale analysis helps unlock unconventional play potential&body=http%3a%2f%2fssl.ihsmarkit.com%2fcommodityinsights%2fen%2fci%2fresearch-analysis%2fwell-bore-scale-analysis-helps-unlock-unconventional-play-potential.html","enabled":true},{"name":"whatsapp","url":"https://api.whatsapp.com/send?text=Well+bore+scale+analysis+helps+unlock+unconventional+play+potential http%3a%2f%2fssl.ihsmarkit.com%2fcommodityinsights%2fen%2fci%2fresearch-analysis%2fwell-bore-scale-analysis-helps-unlock-unconventional-play-potential.html","enabled":true}]}, {"name":"rtt","enabled":true,"mobdesc":"Top"}
]}
