Customer Logins
Obtain the data you need to make the most informed decisions by accessing our extensive portfolio of information, analytics, and expertise. Sign in to the product or service center of your choice.
Customer Logins
BLOG
Jan 20, 2020
Understanding the GHG intensity of crude oil: Composition adds complexity


Environmental, social, and governance performance of companies is increasingly of interest to investors and stakeholders. A key area of focus is understanding how energy transition may affect the oil- and gas-producing assets through to companies. The GHG emission intensity, or emissions per unit of output, has become a key metric of interest, with emphasis on how it may fall or improve. An important part of understanding the GHG emissions associated with oil and gas production, and how emissions may influence competitiveness, is understanding where, how, and why emissions arise. However, upstream oil and gas production is incredibly variable, and the composition of emissions can vary significantly from play to play. This Insight documents how the sources of GHG emissions in upstream hydrocarbonproducing assets vary and the implications for potential improvements.
The dynamism of oil and gas GHG emissions
It should come as no surprise that the GHG emission
intensities of oil and gas production vary by extractive
technology, geology, and geography. This area of research is
potentially one of the most documented related to GHG intensity of
crude oil. However, as IHS Markit has also shown in prior research,
even within a specific play there can be a high degree of
variability. At the same time, the composition of emission sources
can also vary. For example, some operations may be more reliant on
diesel fuel, while others on natural gas. As a result, emission
reduction challenges vary: some plays face more challenges with
natural gas or diesel fuel use, while others may contend with
greater fugitive, venting, or flaring emissions.
Varying composition of GHG emissions in upstream oil and
gas
Although the number of sources of emissions is generally
limited, such as fuel use, venting, and flaring, the composition or
share that each source contributes can be dramatically different.
To illustrate the degree of variation, the compositions of GHG
emission sources of four select North American plays—A, B, C,
and D— are shown in Figure 1. When comparing a single emission
source—flaring, for example—there are different
contributions of total GHG emissions between the examples. In Play
C, flaring makes up less than 1% of the emission profile, while in
Play D it is nearly a third of total emissions. In Play C, fuel use
is responsible for more than four-fifths of emissions, while it is
only about one-fifth for Play A.
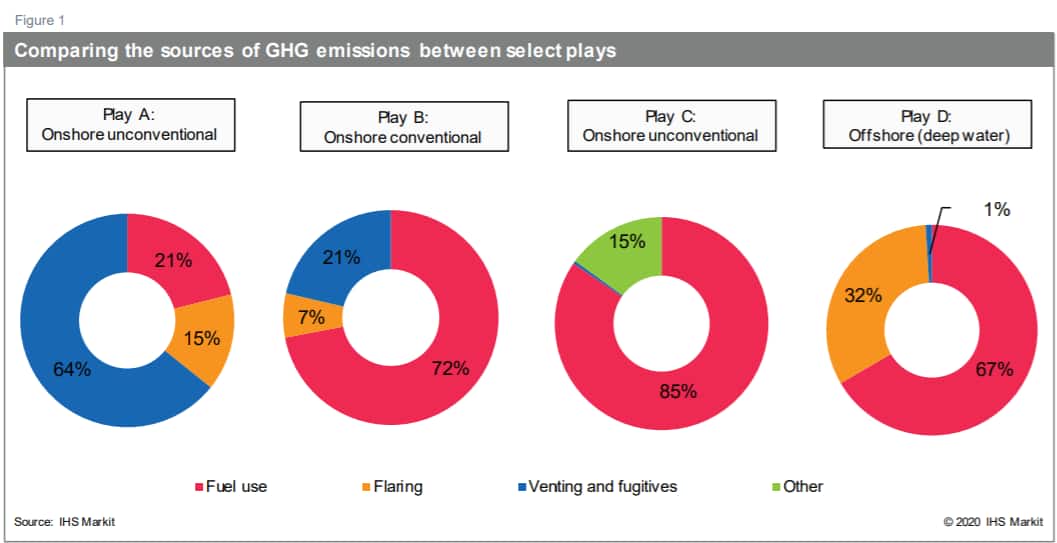
The degree of emission composition variation suggests that emission reduction technologies will have varied impacts across upstream oil and gas plays. For example, addressing venting and fugitive emissions is obviously more impactful (and valuable) for Plays A and B versus C and D. Moreover, while efficiency of fuel use is important for all plays, the benefit may be greater for Plays B, C, and D than for A.
The resource is king
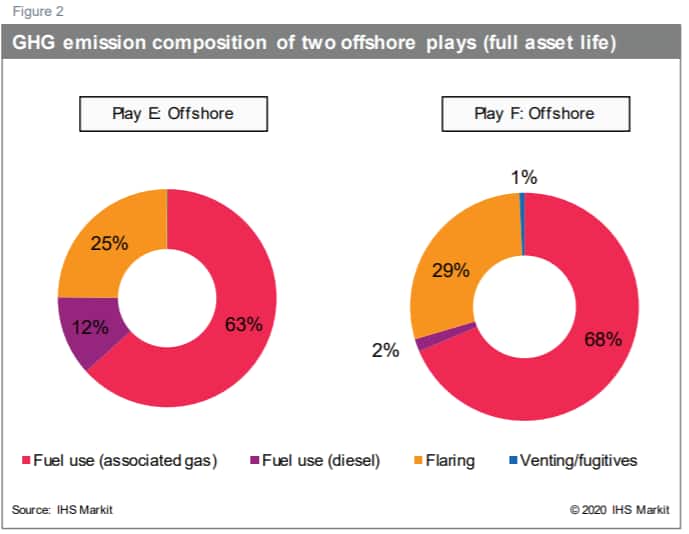
The resource itself plays a critical role in the
composition of GHG emissions. Figure 2 shows two additional
examples of GHG emission profiles for two offshore fields that use
similar extractive technology and are geographically close to one
another. IHS Markit analysis shows that over the approximate
20-plus-year life of these operations, there is a marked difference
in the GHG emission profile resulting from fuel use (namely diesel
in these examples). This difference is a result of the reservoir,
specifically, the gas-to-oil ratio (GOR). Later in the life of the
asset of Play E, the energy demand for production and extraction
exceeds what can be provided by the produced gas and results in an
increase in diesel fuel use. In Play F, the GOR of the reservoir is
higher throughout the life of the field, requiring less diesel fuel
use.
Concluding thoughts
With the variance of emission composition between plays,
it makes sense that there would be a range in the impact of new
decarbonization technologies or efficiency improvements.
Opportunities for reducing the GHG intensity of oil and gas
operations are often resource dependent. Deploying the same
technology at different operations may have varying
impacts—even operations within a small geographic area using
similar extractive technology— so it is important to have a
clear understanding of how and where GHG emissions are
occurring.
These findings illustrate the complexity of GHG accounting and warrant more analysis. IHS Markit is investing in a more sustained and meaningful way in understanding the GHG intensity of crude oil, launching a dedicated team for GHG estimation and accounting. IHS Markit is advancing an initiative to develop "the right measure." We will be partnering with industry and financial institutions to take stock of the current state of GHG emission accounting and estimation. By shedding light on challenges and best practices, we aim to improve the shared understanding of GHG emissions associated with crude oil as well as increase transparency around estimate reliability. IHS Markit aims for this initiative to play a critical role in shaping the future of life-cycle GHG accounting.
The Right Measure Multi-Client Study is a landmark collaboration with Oil & Gas producers and financial institutions to develop a trusted methodology and GHG emissions estimates over the life-cycle of crude oil.
This article was published by S&P Global Commodity Insights and not by S&P Global Ratings, which is a separately managed division of S&P Global.
{"items" : [
{"name":"share","enabled":true,"desc":"<strong>Share</strong>","mobdesc":"Share","options":[ {"name":"facebook","url":"https://www.facebook.com/sharer.php?u=http%3a%2f%2fssl.ihsmarkit.com%2fcommodityinsights%2fen%2fci%2fresearch-analysis%2funderstanding-the-ghg-intensity-of-crude-oil-composition-adds-complexity.html","enabled":true},{"name":"twitter","url":"https://twitter.com/intent/tweet?url=http%3a%2f%2fssl.ihsmarkit.com%2fcommodityinsights%2fen%2fci%2fresearch-analysis%2funderstanding-the-ghg-intensity-of-crude-oil-composition-adds-complexity.html&text=Understanding+the+GHG+intensity+of+crude+oil%3a+Composition+adds+complexity+%7c+S%26P+Global+","enabled":true},{"name":"linkedin","url":"https://www.linkedin.com/sharing/share-offsite/?url=http%3a%2f%2fssl.ihsmarkit.com%2fcommodityinsights%2fen%2fci%2fresearch-analysis%2funderstanding-the-ghg-intensity-of-crude-oil-composition-adds-complexity.html","enabled":true},{"name":"email","url":"?subject=Understanding the GHG intensity of crude oil: Composition adds complexity | S&P Global &body=http%3a%2f%2fssl.ihsmarkit.com%2fcommodityinsights%2fen%2fci%2fresearch-analysis%2funderstanding-the-ghg-intensity-of-crude-oil-composition-adds-complexity.html","enabled":true},{"name":"whatsapp","url":"https://api.whatsapp.com/send?text=Understanding+the+GHG+intensity+of+crude+oil%3a+Composition+adds+complexity+%7c+S%26P+Global+ http%3a%2f%2fssl.ihsmarkit.com%2fcommodityinsights%2fen%2fci%2fresearch-analysis%2funderstanding-the-ghg-intensity-of-crude-oil-composition-adds-complexity.html","enabled":true}]}, {"name":"rtt","enabled":true,"mobdesc":"Top"}
]}