Customer Logins
Obtain the data you need to make the most informed decisions by accessing our extensive portfolio of information, analytics, and expertise. Sign in to the product or service center of your choice.
Customer Logins
BLOG
Aug 19, 2014
The Shale Gale and Natural Gas Storage Inventory: What is Truly Normal?
The Shale Gale has pushed gas production and inventories up for the past several years and IHS Energy projects it will do so again this year. Rising inventories create an inflated 'normal' storage volume and industry predicted winter shortages may not happen.
The increase in US Lower 48 natural gas production that has come with the Shale Gale is as familiar as it has been - and continues to be - astounding. The boom continues despite extremely low gas-directed rig counts. In 2011 and again in 2012, aggregate US production jumped by around 1 Bcf per day from October to November, largely driven by activity-and the timing of related infrastructure additions-in the prolific Marcellus Shale. In 2012, the jump came a couple of months earlier, in July. IHS Energy projects that a similar jump will occur in November 2014. This growth is continuing despite gas-directed rig activity that remains in the low 300's.
Among the many effects of the continuing surge in production has been the distortion, if not outright obliteration, of many traditional metrics that helped us all make sense out of the natural gas market. Much has been made of the changing relation of the gas-directed rig count to changes in production. However, one metric that has been similarly affected has gotten less attention: natural gas storage inventory.
The storage inventory report released weekly by the US Energy Information Administration provides perhaps the most closely watched natural gas market metric for the US Lower 48-other than the Henry Hub price itself-as it provides a near real-time gauge of market supply/demand balance. Recently, Henry Hub gas prices have settled well below "normal" for a period with a US Lower 48 storage deficit (relative to the rolling five-year average) in excess of 700 billion cubic feet (Bcf). Historical relationships suggest a much higher price at these low inventory levels.
Part of the problem is that the increase in production was so rapid that one market response was to increase injections of natural gas into storage. How does this distort the picture? In order to use the storage inventory reports to gauge market conditions, one needs a standard for what constitutes "normal" inventory. IHS Energy, like many market commentators, uses the rolling five year average of inventories for the particular week. This gives a solid base, and at the same time adjusts the level considered "normal" for seasonality.
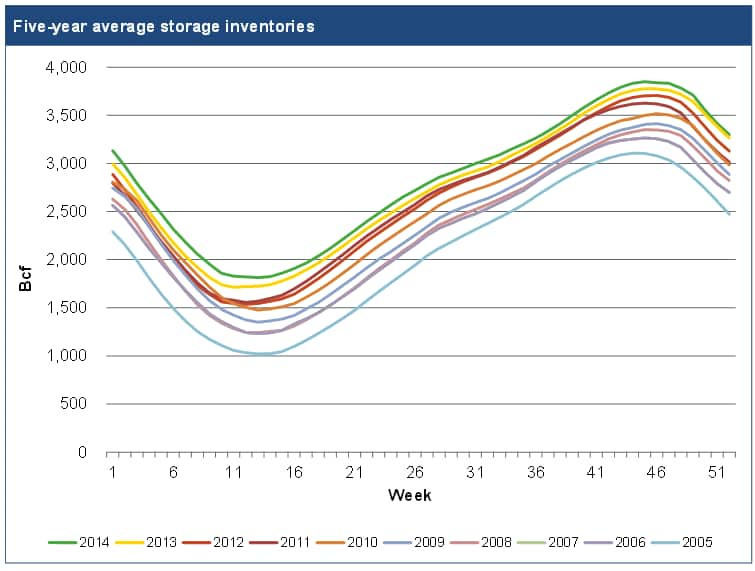
With the surge in production from the Shale Gale has come a steady and strong increase in natural gas storage inventory levels. The five-year-average end-of-October US storage inventory has increased from about 3.3 trillion cubic feet (Tcf) in 2008 to just over 3.8 Tcf in 2013 (see Figure 1). What this means is that the standard for comparison has become inflated to the point where a deficit to the five-year average is considered by many market participants to be less important, because inventory levels that are "truly normal" are well below the current five-year average. What is "truly normal?" This of course is a matter of debate and opinion. Current market behavior seems to suggest that an end-of-October inventory of perhaps between 3.5 and 3.6 Tcf is adequate, and is perhaps what the market considers "normal." IHS Energy projects an end-of-October inventory level of over 3.4 Tcf for 2014.
This is one of several contributing factors that helps explain current Henry Hub natural gas prices of less than $4 per MMBtu despite what remains a large deficit to the five-year-average inventory.
Figure 1 - Five Year Average Storage Inventories

Source: IHS Energy
Learn more about IHS North America Natural Gas.
Posted 19 August 2014
This article was published by S&P Global Commodity Insights and not by S&P Global Ratings, which is a separately managed division of S&P Global.
{"items" : [
{"name":"share","enabled":true,"desc":"<strong>Share</strong>","mobdesc":"Share","options":[ {"name":"facebook","url":"https://www.facebook.com/sharer.php?u=http%3a%2f%2fssl.ihsmarkit.com%2fcommodityinsights%2fen%2fci%2fresearch-analysis%2fthe-shale-gale-and-natural-gas-storage-inventory-what-is-truly-normal.html","enabled":true},{"name":"twitter","url":"https://twitter.com/intent/tweet?url=http%3a%2f%2fssl.ihsmarkit.com%2fcommodityinsights%2fen%2fci%2fresearch-analysis%2fthe-shale-gale-and-natural-gas-storage-inventory-what-is-truly-normal.html&text=The+Shale+Gale+and+Natural+Gas+Storage+Inventory%3a+What+is+Truly+Normal%3f","enabled":true},{"name":"linkedin","url":"https://www.linkedin.com/sharing/share-offsite/?url=http%3a%2f%2fssl.ihsmarkit.com%2fcommodityinsights%2fen%2fci%2fresearch-analysis%2fthe-shale-gale-and-natural-gas-storage-inventory-what-is-truly-normal.html","enabled":true},{"name":"email","url":"?subject=The Shale Gale and Natural Gas Storage Inventory: What is Truly Normal?&body=http%3a%2f%2fssl.ihsmarkit.com%2fcommodityinsights%2fen%2fci%2fresearch-analysis%2fthe-shale-gale-and-natural-gas-storage-inventory-what-is-truly-normal.html","enabled":true},{"name":"whatsapp","url":"https://api.whatsapp.com/send?text=The+Shale+Gale+and+Natural+Gas+Storage+Inventory%3a+What+is+Truly+Normal%3f http%3a%2f%2fssl.ihsmarkit.com%2fcommodityinsights%2fen%2fci%2fresearch-analysis%2fthe-shale-gale-and-natural-gas-storage-inventory-what-is-truly-normal.html","enabled":true}]}, {"name":"rtt","enabled":true,"mobdesc":"Top"}
]}
