Customer Logins
Obtain the data you need to make the most informed decisions by accessing our extensive portfolio of information, analytics, and expertise. Sign in to the product or service center of your choice.
Customer Logins
BLOG
Apr 10, 2020
The North America oil and gas industry enters survival mode


The oil price collapse is rewriting the North America oil and
gas rulebook—forcing companies into survival mode. The
interconnectedness of the industry means impacts ripple throughout
the value chain. This downturn has some structural roots - global
spare capacity that's been building up over the last couple of
years to accommodate the rapid and enormous growth that we've seen
in the North American oil and gas production. When we add this
spare capacity onto the demand disruption created by the
Coronavirus and the oil price war, it means major challenges for
North America.
To hear more in-depth analysis directly from our experts, view the on-demand webinar from
April 2nd.
Unprecedented Demand Slowdown
While there's plenty of talk about when OPEC and Russia will resume
their collaboration, the reality is that it may not matter. Two
main factors may overwhelm what they can do. First, the magnitude
of the physical imbalance we're looking at in the second quarter,
globally, and in North America, and secondly, the distress and how
it's feeding from the physical side into the pricing side.
A majority of the pressure we are seeing is coming from demand
destruction. Obviously, there was a breakdown of the relationship
between Saudi Arabia and Russia earlier this month that led to an
all-out surge in production. But, when you look at the grand scheme
of the balance in the oil market globally, it's really a demand
crash—the scale of which we've never seen before.
To put the magnitude into perspective, in the 2008-09 recession, at
its worst in January and February of 2009, global oil demand had
contracted year-on-year by around 4 million barrels a day. The
scale of the demand collapse we're looking in the second quarter is
in the 15- 20 million barrels a day decline range—potentially
more than 20 million barrels a day decline in April. That's five
times larger in terms of a demand collapse than we had at the worst
of the financial crisis.
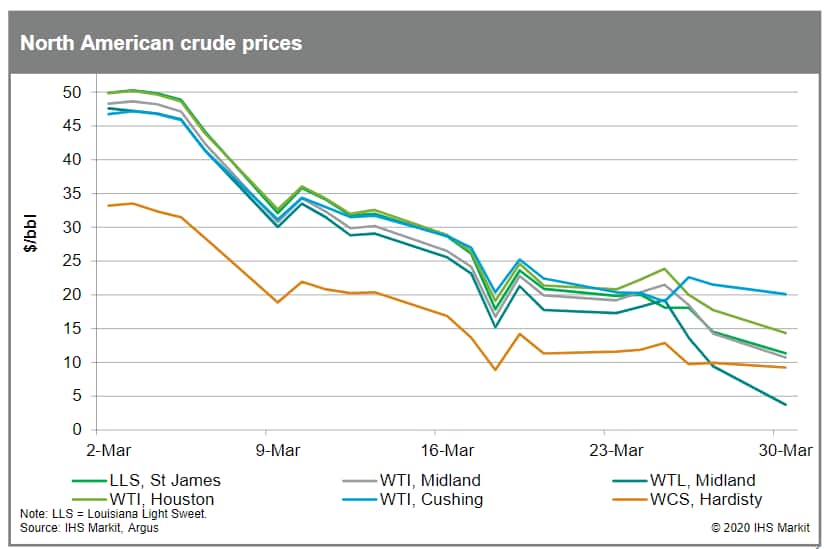
Figure 1: North American crude oil prices
We've also analyzed the impact of country shutdowns in response to coronavirus. This orange and red in the below chart shows you that by the end of March around 86% of global gasoline demand was in countries that have severe or full shutdowns in effect. The global market is slowing down quite dramatically in terms of demand. That scale of a demand drop is creating a balance distress.
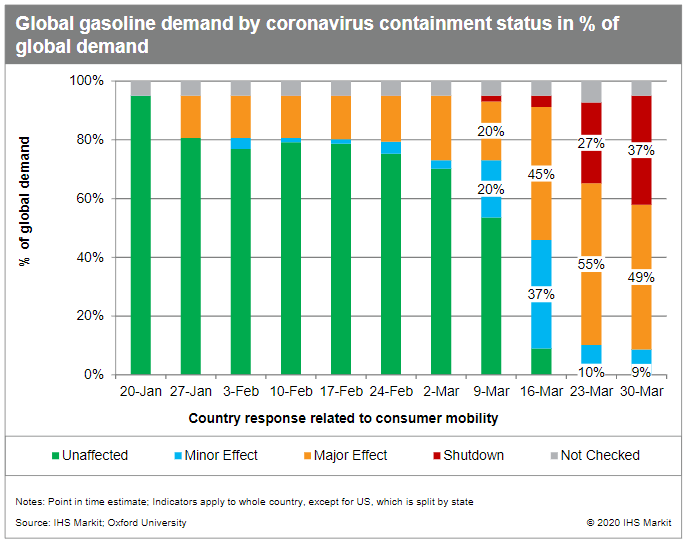
Figure 2: Global gasoline demand by coronavirus containment status
Another consequence of the oversupply is a strain on global
storage capacity. We expect to build inventories over the next few
months—storage hubs are nearly full and tankers are getting
chartered around the world for floating storage. Even more
important in the near term is that the daily global surplus exceeds
the capability to effectively flow into storage: storage
availability thousands of miles away is meaningless if you cannot
find a ship or lease the storage.
Operators Shift to Capital Preservation
Coming into this year, early January and February, we were looking
at moderate capex cuts compared to 2019—a 13% decline in capex
cost. Operators were obsessed with balancing production growth
against the cashflow and using any of the accessory cashflow to
give back to shareholders.
Now, with March now done, we've seen capex declines go from
moderate to significant. We expect now at least a 36% decline in
total capex spends in 2020. And, these numbers are going to
increase as oil prices continue to fall.
Instead of trying to balance production growth and cashflow
generation, we're seeing companies move to capital preservation.
That means reducing dividends and eliminating share buyback.
There's barely any excess cash out there, so they're not able to
give it back to shareholders.
Capital markets have tightened even further. Equity markets have
remained closed. And, if you look at yields on fixed income
securities for operators out there, they have spiked significantly
to abnormal levels. This means that companies, especially smaller
ones, are going to have a lot of trouble borrowing money.
The US Supply Trajectory
Given the uncertainty in the market, we've run multiple scenarios
for US oil production. Our original base case had supply growing
just in the first half of this year and then holding flat for the
next 18 months through the end of 2021. In short—we were
oversupplied already.
Now, we look at where we are coming in with this amazing
unprecedented demand disruption. Estimates are about a two and a
half million barrel a day drop this year compared to where we were
thinking, and then another million next year.
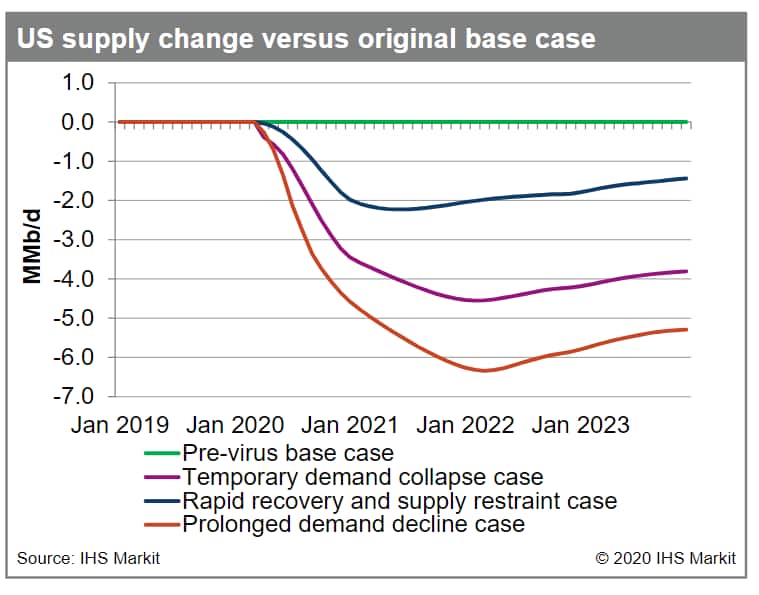
Figure 3: US supply change versus original base
case
Originally, our base case was growing a little bit. Now we're
looking at coming down to right around 9 million barrels a day by
the end of next year. So, the difference between our base case and
the current levels is about 4.5 million barrels a day.
When we do a play-by-play comparison, the Permian plays register
the largest overall production drop by volume. The SCOOP/STACK,
Wattenberg, and Eagle Ford output fall at a far greater rate on a
percentage basis. Why does the Permian take it the hardest? First,
it's where the most activity is by percentage and it's also got a
very steep base decline. The Bakken and Eagle Ford have lower base
decline rates than the Permian. But the Permian also rebounds most
if/when prices come back.
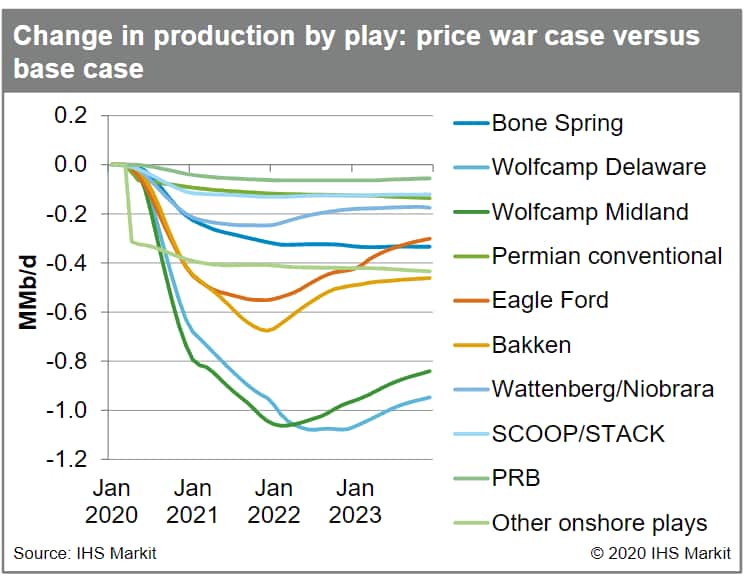
Figure 4: Change in production by play
The Natural Gas Silver Lining and the LNG
Wildcard
The prospect for significant decline in associate gas production
has really changed the prospects for gas-focused operators. Our
expectation for US associated gas production for 2021 went from
about 2 BCF a day of growth to roughly 8 BCF a day of decline -- a
swing of around 10 BCF a day.
LNG liquefaction plants' gas demand has been all-time highs over
the past couple weeks, closing in on about 10 BCF a day. However,
the global gas market and LNG demand are not immune from the demand
destruction impacts of COVID-19. LNG demand growth is slowing, and
when we look around the globe, coal and gas switching as a result
of low gas prices is not expected to lead to enough immediate new
demand to achieve market balance.
Instead, the market is expected to balance on supply cutbacks. LNG
cutbacks are expected across the globe, but they're not all going
to be concentrated in the United States. Our current analysis
suggests that we could see US LNG exports averaging between 80 and
90% utilized in 2020 and 2021. This would indicate that the US
market is going to require a significant amount of dry gas
production to come back in 2021 to help balance the market, if that
associated gas production does fall off. In order for this to
occur, we're likely going to have to see gas prices rise to or
above $3, and maybe average about $3.50 for the year in 2021. At
these levels, we would expect gas demand from the power sector to
decline as coal generation would start to reenter the mix.
In the short-term for 2020, we see prices averaging under $2.00,
but expect prices to improve in 2021. How much is going to depend
on a lot of factors, including the extent to which associate gas
declines, the extent to which the domestic and demand LNG exports
decline, and how quickly dry natural gas production can
increase.
Midstream in the Crossfire
The NGL outlook shows a drastic drop in NGL supply. In 2018 and
2019, we saw double digit growth in NGL production since it is a
byproduct of crude and associated gas growth.
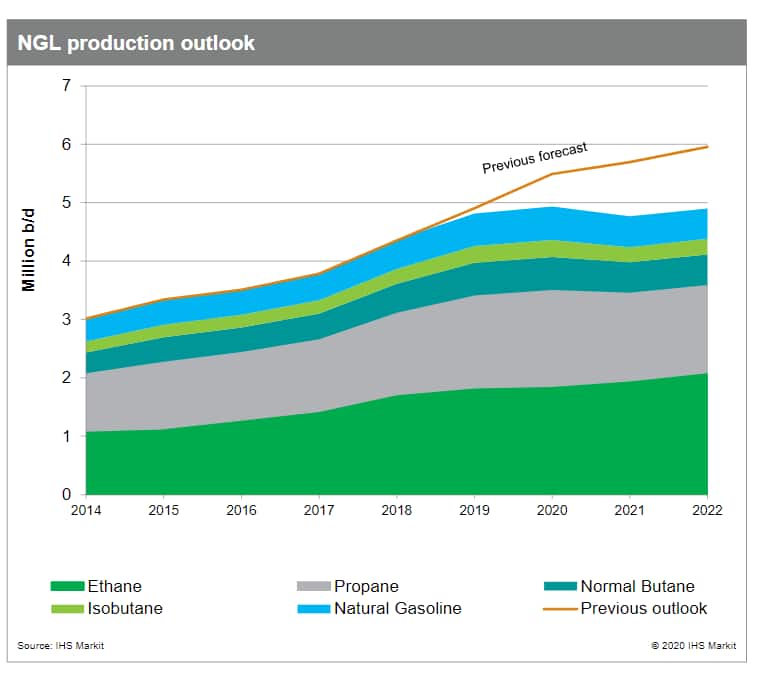
Figure 5: NGL production outlook
Post-Coronavirus, we still see some increase in NGLs in 2020, kind
of year over year growth. But 2021 is very different as NGL
production growth will hit the brakes when crude and gas production
reverses. Regionally, we expect a reduction from South and West
Texas while at the same time there should be some increases from
the Utica. Overall compared to our previous outlook, we believe
2021 will have a decline of about 0.9 million barrels a day, with
more in 2022.
Hear more in-depth insights about the North America oil and gas
outlook by viewing the on-demand
webinar.
Raoul LeBlanc is Vice President, Unconventionals
Research at IHS Markit.
Karim Fawaz is Director, Research and Analysis at IHS
Markit.
Hassan Eltorie is Director, Companies and Transactions
Research at IHS Markit.
Reed Olmstead is Director, North American Onshore Upstream
at IHS Markit.
Matthew Palmer is Director, North American Gas at IHS
Markit.
Veeral Mehta is Director, Midstream Consulting at IHS
Markit.
Posted 10 April 2020.
This article was published by S&P Global Commodity Insights and not by S&P Global Ratings, which is a separately managed division of S&P Global.
{"items" : [
{"name":"share","enabled":true,"desc":"<strong>Share</strong>","mobdesc":"Share","options":[ {"name":"facebook","url":"https://www.facebook.com/sharer.php?u=http%3a%2f%2fssl.ihsmarkit.com%2fcommodityinsights%2fen%2fci%2fresearch-analysis%2fthe-north-america-oil-and-gas-industry-enters-survival-mode-.html","enabled":true},{"name":"twitter","url":"https://twitter.com/intent/tweet?url=http%3a%2f%2fssl.ihsmarkit.com%2fcommodityinsights%2fen%2fci%2fresearch-analysis%2fthe-north-america-oil-and-gas-industry-enters-survival-mode-.html&text=The+North+America+oil+and+gas+industry+enters+survival+mode++%7c+S%26P+Global+","enabled":true},{"name":"linkedin","url":"https://www.linkedin.com/sharing/share-offsite/?url=http%3a%2f%2fssl.ihsmarkit.com%2fcommodityinsights%2fen%2fci%2fresearch-analysis%2fthe-north-america-oil-and-gas-industry-enters-survival-mode-.html","enabled":true},{"name":"email","url":"?subject=The North America oil and gas industry enters survival mode | S&P Global &body=http%3a%2f%2fssl.ihsmarkit.com%2fcommodityinsights%2fen%2fci%2fresearch-analysis%2fthe-north-america-oil-and-gas-industry-enters-survival-mode-.html","enabled":true},{"name":"whatsapp","url":"https://api.whatsapp.com/send?text=The+North+America+oil+and+gas+industry+enters+survival+mode++%7c+S%26P+Global+ http%3a%2f%2fssl.ihsmarkit.com%2fcommodityinsights%2fen%2fci%2fresearch-analysis%2fthe-north-america-oil-and-gas-industry-enters-survival-mode-.html","enabled":true}]}, {"name":"rtt","enabled":true,"mobdesc":"Top"}
]}