Customer Logins
Obtain the data you need to make the most informed decisions by accessing our extensive portfolio of information, analytics, and expertise. Sign in to the product or service center of your choice.
Customer Logins
BLOG
Jan 30, 2019
Subsurface models, bleeding cores and quantifying in-place fluid volumes
In part two a three-part series on conventional opportunities in an unconventional world, Mark Savery, Executive Director Upstream Product Management at IHS Markit sits down with Thomas G. Harris, President & CEO at BlackRock Exploration & Production to discuss bleeding cores and how historical data plays a role in the development of subsurface models.
Mark Savery:
Tom, in our last discussion we concluded with a lead-in to the importance of subsurface models in evaluating play opportunities. What is a subsurface model, and why is it important?
Tom Harris:
Mark, in its simplest form, a subsurface model is a prototype built from existing data using geoscience and engineering methods to quantify the location, in-place volume and types of fluids and gases found in the subsurface. It should estimate the recoverable volumes of hydrocarbons and forecast product flow streams for oil, gas, and water with attendant pressures.
So, let's now move into a more granular level of investigation. A good place to start might be a discussion using legacy core data.
Access to historical core data & descriptions is a competitive advantage. For example, many years ago the industry would collect and share a lot of subsurface information using sampling or coring techniques for formation evaluation. Over time as wireline logging technology evolved and improved, the amount of material cored was drastically reduced, and industry-wide sharing of data has also declined. Hence, just the mere existence of historical core descriptions available for inspection is a leg up.
Of course, as part of this investigation I would also like to know if there are measurements and descriptions available for the cores taken in the target formation, or if the core material is available for inspection and/or sampling. However, it is my experience that historical core data is rich with information and contains "nuggets of gold." IHS Markit is an example of a data provider with very strong core information, which is critical in making decisions and comparing results from today with those of the past. It's not very common for core to be taken from wells today, so the historical data takes on a new level of importance. One of my favorite diagnostic attributes for challenged or tight oil reservoirs is a bleeding core description.
Mark Savery:
Why are bleeding cores significant?
Tom Harris:
I think of a bleeding core as a qualitative proxy for tight oil (or gas) formations, just as a black or gray shale description is a proxy for Total Organic Carbon (TOC) in a source rock resource play. Perhaps this is best described through the eyes of a new hire geologist from the early 1970's or 1980's. Visualize him or her driving out to an onshore rig in the gulf coast to witness their first coring run. Their enthusiasm is at an all-time high because they have never seen a coring operation or rig before, let alone experienced what an oil or gas reservoir rock looks like from depths of 10 to 15 thousand feet below the surface. Now imagine their excitement as they place a call back to the home office when the core is extruded from the core barrel, and they see and describe in all their delight, hydrocarbons bleeding or oozing from the rock after it makes the hours long trip out of the well bore to the derrick floor.
Of course, they are shocked to find that their enthusiasm is not shared by the district manager in the home office as he has concluded from their description of the core that the well and formation is probably non-commercial and too tight to produce. His reasoning is that any hydrocarbons contained in a commercial porous and permeable reservoir rock from 15,000 feet should have been flushed by the drilling fluids during the 3-hour trip out of the well bore. The mere mention of a bleeding core on the derrick floor conjures up an interpretation of a low permeability zone that is non-commercial, and the conclusion that the well should be plugged.
So why or how is this significant you ask? I like to search legacy data for abandoned wildcat wells with text descriptions of bleeding cores to identify prospective lead areas for further examination. Technology and prices have changed significantly over the years, and rocks that were once described as having low permeability are now viable targets for exploitation, especially if they have recorded indications of hydrocarbons. IHS Markit core data remarks are instrumental to this process.
I first recognized the importance of this in the early 1980's after I read two AAPG articles authored by an ex-Shell geologist named Tim Schowalter. Tim first wrote about the mechanics of secondary migration within a petroleum system, and then later described techniques and methods to assess subsurface hydrocarbon "shows." He described one such show as a "waste zone" or a tight rock that is transitional and/or adjacent to a commercial reservoir and a lateral seal. This was years before the shale revolution began.
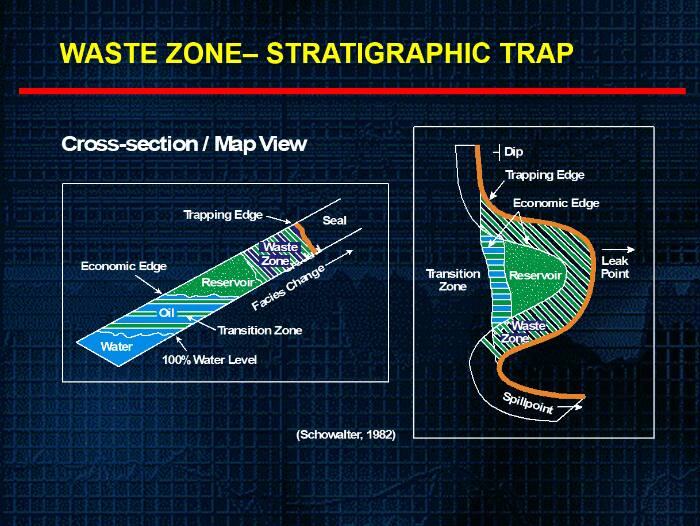
Figure 1: Waste Zone- Stratigraphic Trap
He further described a procedure Shell had developed using Mercury-Injection-Capillary Pressure (MICP) on drill cuttings to quantify hydrocarbon column heights down-dip from waste zone penetrations. In other words, if the well had encountered a "waste zone," would you be able to recognize whether you had penetrated the "tail of an elephant" or just the tail of a rat? Previously, industry had only applied MICP on conventional core plugs.
Using real world data from a disguised field named "Pay Dirt," Schowalter asked in hindsight if you had drilled the Placid Edenborn #13 well first, would you have recognized that you had encountered the up-dip feathers edge of a 280-foot hydrocarbon column of a giant oil and gas field? Note that the core description mentions the core bled condensate.
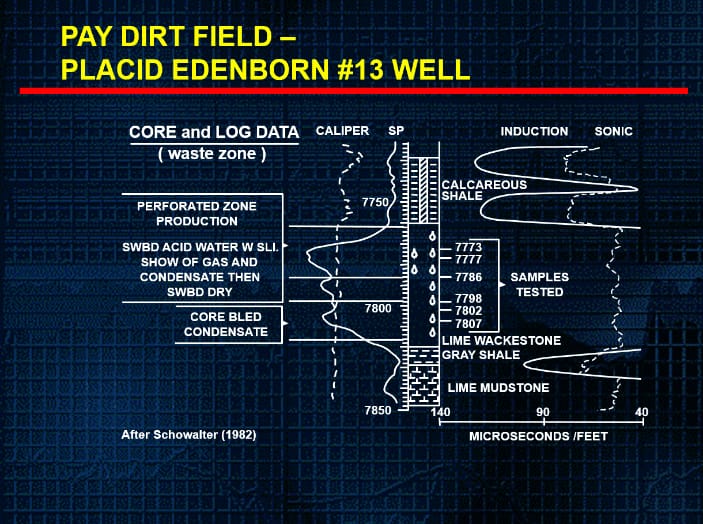
Figure 2: Pay Dirt Field- Placid Edenborn #13 Well
It turns out that Pay Dirt field is in fact Black Lake field in North Louisiana and has produced 65 MMBO and 1.5 TCF of gas.
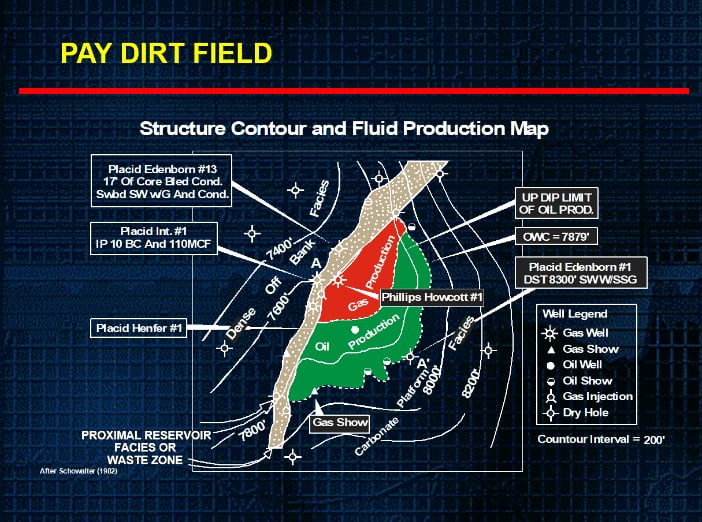
Figure 3: Pay Dirt Field
When I first read the article 36 years ago, I thought it would be exciting to find additional stratigraphic traps down-dip of waste zone shows instead of moving traditionally up-dip to known shows.
Mark Savery:
How do you use this knowledge about bleeding cores to find oil and gas?
Tom Harris:
I began my oil and gas career across a five-state area in the onshore gulf coast. It was informally known as MAFLA, and included the states of Mississippi, Alabama, Florida, Louisiana, and Arkansas. As an explorer, one technique I used began with examining descriptions of bleeding cores in abandoned wildcats across a geographic area and clustering the results by their formation name. That is how I learned years ago the fictitious Pay Dirt Field was Black Lake field.
By focusing only on abandoned wildcats, numerous cored development wells taken within producing fields were eliminated. By clustering by formation, known source rocks were quickly identified for analysis using different methods than traditional or conventional methods relevant for secondary migration and entrapment. I have also expanded the search to include the Texas gulf coast, but the process is applicable to any basin worldwide. Earlier this year I searched the DJ basin in Colorado for cored Codell formation wells using IHS Markit core data and created a word cloud from the descriptive text narratives. It was quite telling.
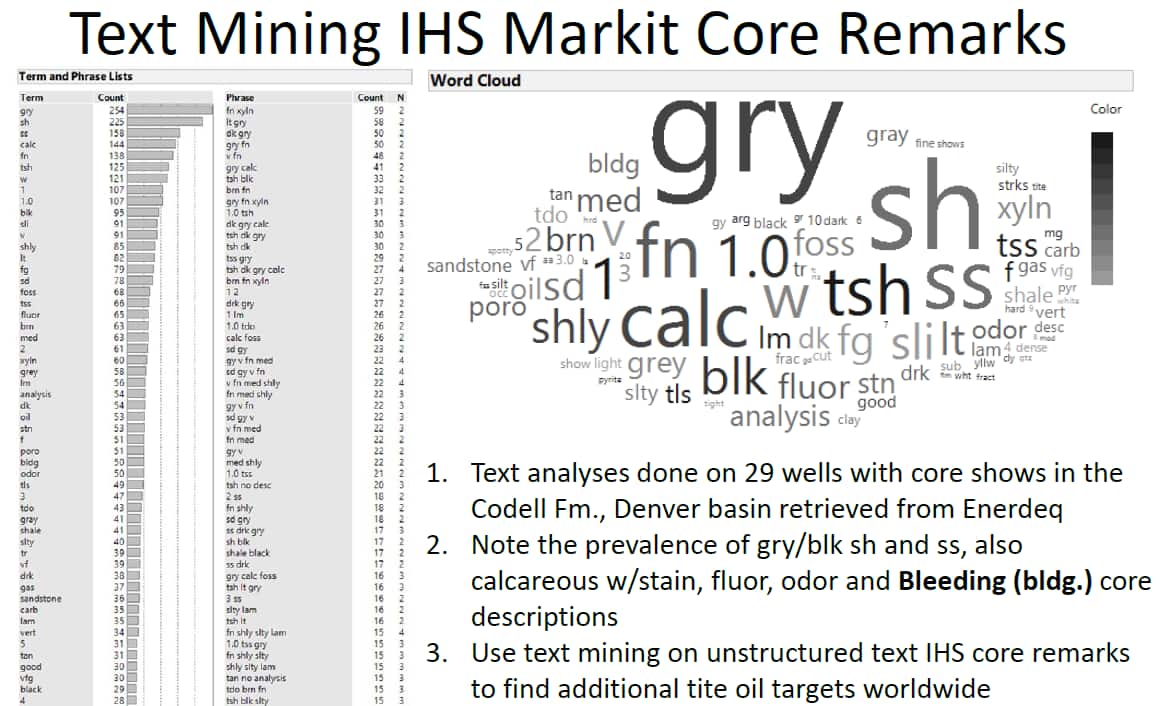
Figure 4: Word Cloud from Core Data
Check back next week for the conclusion of this series, Conventional opportunities in an unconventional world: Keys to future exploration success in the face of technology & generational shifts.
Posted 30 January 2019
This article was published by S&P Global Commodity Insights and not by S&P Global Ratings, which is a separately managed division of S&P Global.
{"items" : [
{"name":"share","enabled":true,"desc":"<strong>Share</strong>","mobdesc":"Share","options":[ {"name":"facebook","url":"https://www.facebook.com/sharer.php?u=http%3a%2f%2fssl.ihsmarkit.com%2fcommodityinsights%2fen%2fci%2fresearch-analysis%2fsubsurface-models-bleeding-cores-and-quantifying-inplace-fluid.html","enabled":true},{"name":"twitter","url":"https://twitter.com/intent/tweet?url=http%3a%2f%2fssl.ihsmarkit.com%2fcommodityinsights%2fen%2fci%2fresearch-analysis%2fsubsurface-models-bleeding-cores-and-quantifying-inplace-fluid.html&text=Subsurface+models%2c+bleeding+cores+and+quantifying+in-place+fluid+volumes+%7c+S%26P+Global+","enabled":true},{"name":"linkedin","url":"https://www.linkedin.com/sharing/share-offsite/?url=http%3a%2f%2fssl.ihsmarkit.com%2fcommodityinsights%2fen%2fci%2fresearch-analysis%2fsubsurface-models-bleeding-cores-and-quantifying-inplace-fluid.html","enabled":true},{"name":"email","url":"?subject=Subsurface models, bleeding cores and quantifying in-place fluid volumes | S&P Global &body=http%3a%2f%2fssl.ihsmarkit.com%2fcommodityinsights%2fen%2fci%2fresearch-analysis%2fsubsurface-models-bleeding-cores-and-quantifying-inplace-fluid.html","enabled":true},{"name":"whatsapp","url":"https://api.whatsapp.com/send?text=Subsurface+models%2c+bleeding+cores+and+quantifying+in-place+fluid+volumes+%7c+S%26P+Global+ http%3a%2f%2fssl.ihsmarkit.com%2fcommodityinsights%2fen%2fci%2fresearch-analysis%2fsubsurface-models-bleeding-cores-and-quantifying-inplace-fluid.html","enabled":true}]}, {"name":"rtt","enabled":true,"mobdesc":"Top"}
]}