Customer Logins
Obtain the data you need to make the most informed decisions by accessing our extensive portfolio of information, analytics, and expertise. Sign in to the product or service center of your choice.
Customer Logins
BLOG
Feb 13, 2020
From start to finish: Stages of life impact on oil and gas greenhouse gas emission intensity


Governments, industry, investors, and other stakeholders are increasingly interested in understanding the implications of energy transition on the competitiveness of upstream oil and gas operations. Greenhouse gas (GHG) intensity, or emissions per unit of output, has become a key metric of interest. However, GHG emissions associated with oil and gas extraction through end use are variable and dynamic. Not only do GHG emission intensities differ from play to play, by extractive technology, by resource quality, and by operator efficiency, but they also change over time. Emissions during ramp-up and decline of an asset are potentially multiple times higher than during normalized midlife operations. In prior Insights, IHS Markit has explored some of these other sources of variability and uncertainty. This Insight discusses how emission intensity can evolve over the life of an oil- or gas-producing asset and why it matters.
Life cycle impacts life-cycle emissions
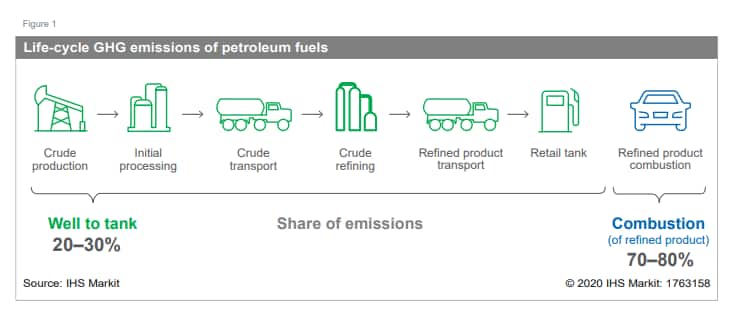
"Life-cycle analysis" typically refers to the accounting of
greenhouse gas (GHG) emissions that arise at each stage throughout
the product's life. For liquid hydrocarbons, the stages typically
include extraction or production, transportation to market,
refining, and ultimately end use in a car or a truck (see Figure
1).
The GHG emission profiles of oil and gas operations, however, are
dynamic and change over the life of an asset. GHG emissions and
emission intensity for oil and gas operations will vary from month
to month or year to year. Moreover, as a play moves through its
life, the emission intensity will undergo distinctive stages. In
some periods of the life of the operations, the difference in
emissions can be significant—emission intensity during ramp-up
and toward end of life can potentially be multiple times higher
than normalized midlife operations. As a result, the stages of life
will impact the shifting competitive pressures of energy transition
on oil and gas resources and the mitigation strategies companies
may pursue.
An illustrative example: Phases of life of an upstream
(offshore) oil operation
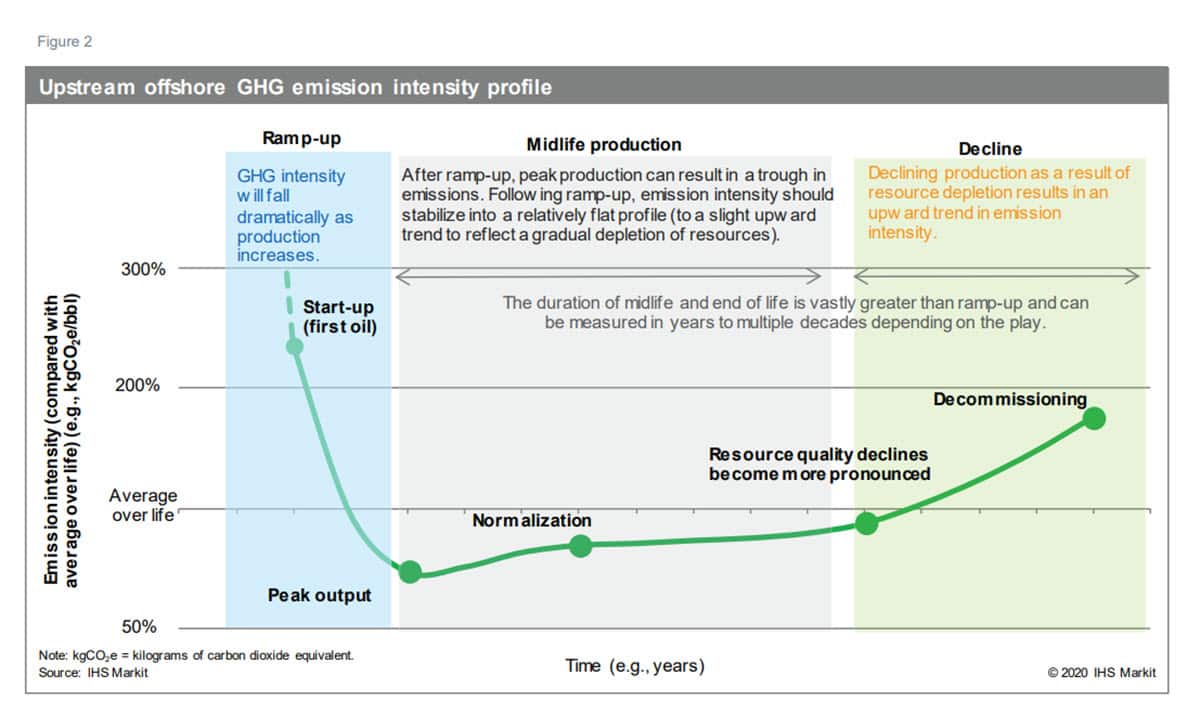
In Figure 2, IHS Markit illustrates three phases of life in the GHG
emission intensity of an oil- and gasproducing operation.*Further
below is a brief description of each stage. It should be noted that
although the relative scale can vary from play to play, this
general profile is likely similar for most oil- and gas-producing
operations. However, the duration of each of these phases can vary
dramatically. While ramp-up is typically the shortest, the duration
of midlife production and end of life can span decades. This
example is drawn from a sample of large offshore crude oil-focused
operations.**
- Ramp-up (early life). The ramp-up of oil-producing operations requires up-front energy expenditures to turn on necessary equipment, drill out, and/or tie into producing wells, as well as run up internal systems. Some emission sources may also be elevated, such as flaring, as key processes come online. The precise profile and ramp-up of this phase of life depend on when accounting for emissions begins—at construction, when power consumption starts, or at first oil. Regardless, until production is achieved, emission intensity would theoretically be infinite (shown in the hashed green line in Figure 2). For our illustration, the solid line represents the profile after oil production begins. The low levels of production at the onset result in very high GHG emissions per unit of output. As production ramps up, typically quickly, the GHG intensity sharply declines. This period of life is typically the shortest lived, and the impact on the emission intensity over the life of an asset can be relatively small.
- Production (midlife). Once production is ramped up and the facility approaches its designed operating capacity, GHG emission intensity stabilizes into a relatively flat profile. A peak in production early in life can result in a trough in emission intensity, as shown in Figure 2. Over this period, the GHG emission intensity is very sensitive to system outages and upsets—periods where much of the energy consumption is maintained but production is interrupted. Keeping a producing facility well maintained and output high helps maximize output and minimize emission intensity and results in a relatively stable emission intensity profile year over year.*** Improvements will occur with the application of new technology or efficiency projects that lead to absolute emission reductions or increases in output or reduced downtime (reliability improvements). The duration of this period can vary dramatically from play to play—from months to multiple decades.
- Decline (maturity). As a producing operation begins to near the end of its life, the emission intensity will increase. This result relates to the quality of the resource that underpins operations. Over time, the productivity or share of hydrocarbons recovered per day will decline, resulting in an upward trend in GHG intensity. Tying in new fields can bring in new high-quality resources and extend the relatively flat midlife production phase. Other technologies can be deployed to mitigate production declines, such as additional pumps that can increase recovery. However, many of these recovery assisting technologies still come with increased energy requirements and contribute to a rise in GHG intensity. Eventually, as the underlying resource declines, emission intensity will increase toward the end of life, until such a time that the level of output no longer justifies economic operation. Although not shown, energy and GHG emissions will occur in decommissioning and reclamation after a project is shut down.
Emission mitigation may require actions beyond just
operators
Because emission profiles are distinct in each stage of life, the
approaches to emission mitigation may differ as well. The
challenges posed by energy transition may also differ depending on
not only where, but when the majority of an oil and gas company's
production sits in its life cycle and the duration that each stage
may span—and thus the significance of each stage. For example,
finding ways to accelerate ramp-up or mitigate energy use (ramping
energy use more attuned to production) can help reduce the ramp-up
intensity and duration, as can ensuring emission mitigation
infrastructure, such as natural gas gathering, is online to meet
supply. Similarly, toward the end of life, greater concern over GHG
emissions could encourage an earlier or more accelerated end to the
economic life of production—truncating the rise in emission
intensity. However, in many oil-producing regions, governments have
imposed rules to preserve and maximize resource extraction. These
rules can include explicit directives on how much resource must be
recovered before an operator can terminate operations and
decommission a facility. In some senses, these legacy rules may run
counter to emerging policies aimed at reducing GHG emissions
(absolute or intensity).
Concluding remarks
IHS Markit is investing in a more sustained GHG Accounting and
Estimation capability—seeking to better understand the GHG
emissions associated with the production through end use of
hydrocarbons in our world today. This accounting of emissions is
known as life-cycle analysis. This Insight, however, suggests that
researchers should also consider how emissions may evolve over the
life of an oil- or gas-producing operation, which may result in
different strategies to improve the emission profile. This result
underscores the complexity in trying to understand the implications
of the energy transition on the oil and gas industry.
* Depending on whether someone is exploring emissions,
cost, or production, there are different definitions for the life
of an oil-producing asset. Examples include land acquisition,
exploration, construction/development, and then decommissioning and
restoration. For this Insight, we are focused on GHG
emissions.
**The figure is derived by averaging the actual GHG
emission intensity profile of a range of facility-based oil
production operations, including from initial stages to near
end-of-life operations. It should be noted that the generation of
this figure is not a trivial endeavor and required modeling fields
that have been in operation for up to nearly a quarter
century
***Looking at emission intensity over shorter periods will
show greater variability in emissions than the annual averages
shown in Figure 1—planned maintenance outages or even unplanned
outages do occur, which can result in emission intensity spikes
over shorter periods
This article was published by S&P Global Commodity Insights and not by S&P Global Ratings, which is a separately managed division of S&P Global.
{"items" : [
{"name":"share","enabled":true,"desc":"<strong>Share</strong>","mobdesc":"Share","options":[ {"name":"facebook","url":"https://www.facebook.com/sharer.php?u=http%3a%2f%2fssl.ihsmarkit.com%2fcommodityinsights%2fen%2fci%2fresearch-analysis%2fstages-of-life-impact-oil-gas-greenhouse-gas-emission-intensity.html","enabled":true},{"name":"twitter","url":"https://twitter.com/intent/tweet?url=http%3a%2f%2fssl.ihsmarkit.com%2fcommodityinsights%2fen%2fci%2fresearch-analysis%2fstages-of-life-impact-oil-gas-greenhouse-gas-emission-intensity.html&text=From+start+to+finish%3a+Stages+of+life+impact+on+oil+and+gas+greenhouse+gas+emission+intensity+%7c+S%26P+Global+","enabled":true},{"name":"linkedin","url":"https://www.linkedin.com/sharing/share-offsite/?url=http%3a%2f%2fssl.ihsmarkit.com%2fcommodityinsights%2fen%2fci%2fresearch-analysis%2fstages-of-life-impact-oil-gas-greenhouse-gas-emission-intensity.html","enabled":true},{"name":"email","url":"?subject=From start to finish: Stages of life impact on oil and gas greenhouse gas emission intensity | S&P Global &body=http%3a%2f%2fssl.ihsmarkit.com%2fcommodityinsights%2fen%2fci%2fresearch-analysis%2fstages-of-life-impact-oil-gas-greenhouse-gas-emission-intensity.html","enabled":true},{"name":"whatsapp","url":"https://api.whatsapp.com/send?text=From+start+to+finish%3a+Stages+of+life+impact+on+oil+and+gas+greenhouse+gas+emission+intensity+%7c+S%26P+Global+ http%3a%2f%2fssl.ihsmarkit.com%2fcommodityinsights%2fen%2fci%2fresearch-analysis%2fstages-of-life-impact-oil-gas-greenhouse-gas-emission-intensity.html","enabled":true}]}, {"name":"rtt","enabled":true,"mobdesc":"Top"}
]}