Customer Logins
Obtain the data you need to make the most informed decisions by accessing our extensive portfolio of information, analytics, and expertise. Sign in to the product or service center of your choice.
Customer Logins
BLOG
Jan 06, 2016
Pressure dependent permeability in overpressured shales
In this article, we present several important findings regarding performance analysis of overpressured shales:
- Inconsistencies observed in the analysis of production and buildup data from selected Haynesville wells provide strong evidence of a productivity index that degrades over time.
- The source of the productivity loss is indeterminable using well performance analysis alone (changing kh, skin, fracture length, conductivity?).
- Rate transient analysis, on its own, can significantly underpredict OGIP and EUR in these reservoirs.
- If pressure buildup data is available following some production, it can provide a clear diagnostic of the inconsistency of interpretation.
- Using analytical models that treat permeability as a pressure dependent variable, one can obtain satisfactory history matches of both production and buildup data that could not be otherwise matched using conventional "static" model.
- Using these analytical models with pressure dependent permeability, one can meaningfully predict the long-term deliverability for overpressured shale gas wells.
Background
In some gas fields, such as the Haynesville, pore pressure can be abnormally high. This creates conditions where, as production occurs through time, effective permeability may be reduced significantly because of gradual fracture closure due to compaction. This mechanism of pressure dependent permeability has been well established experimentally, through core analysis, but has proved difficult to identify from well performance analysis.
Well Performance Analysis
The motivation for this work arises from the need to explain the observation of inconsistencies between production and buildup data from the same well. The inconsistencies could only be resolved using a model for which well productivity degrades through time. There may be different explanations, such as increasing damage skin or influx of liquids at the wellbore, but since we are dealing with the Haynesville, it is reasonable to assume that the observed productivity loss is caused by pressure dependent permeability.
When analyzing well performance data using IHS RTA, a gradual loss in well productivity over time cannot be easily identified. Furthermore, if such a productivity loss is present, it will likely lead to incorrect (pessimistic) estimates of OGIP and EUR. Consider the example shown in Figure 1.
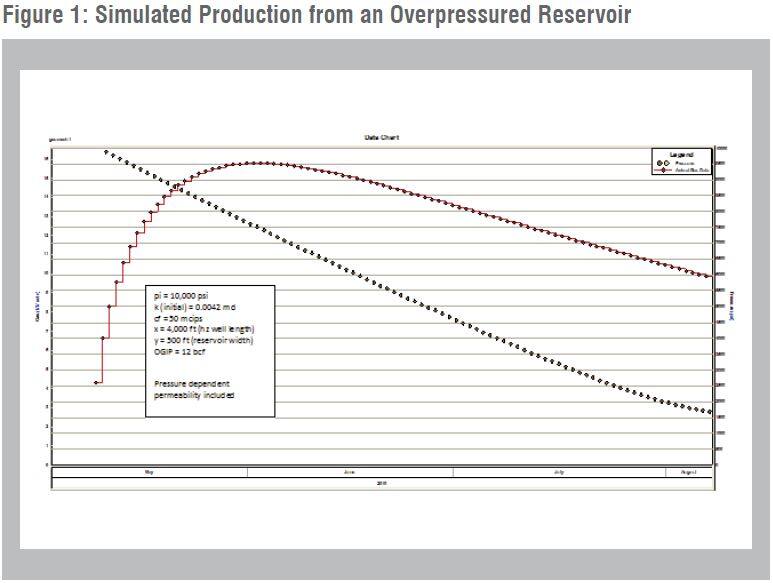
In this example, production is simulated from a Haynesville-like reservoir for a three month period, using IHS RTA. The well is produced at restricted rates and declining flowing pressures, similar to real operating conditions observed in the Haynesville. The data are created using a model that simulates a permeability that declines exponentially with pressure (Figure 2).
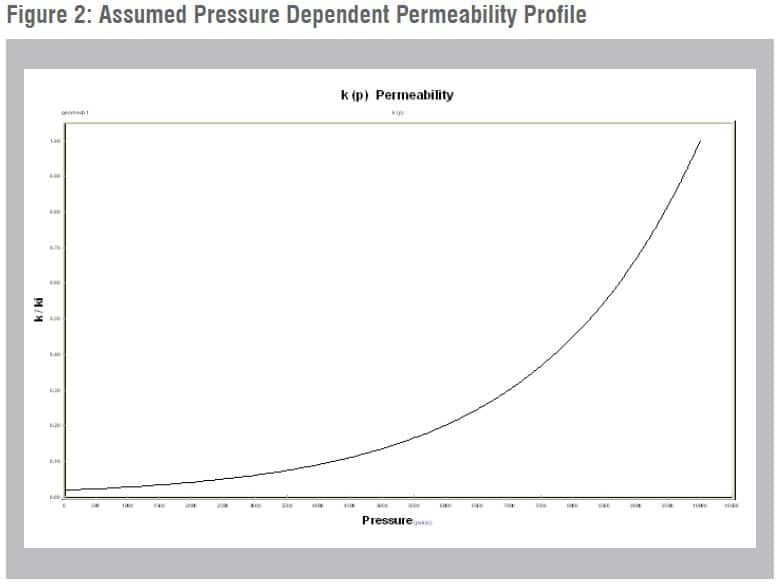
Yilmaz and Nur have proposed this form of permeability decline, based on experimental core analysis from tight gas wells. These data are analyzed using the Flowing Material Balance (FMB), ignoring pressure-dependent permeability (Figure 3).
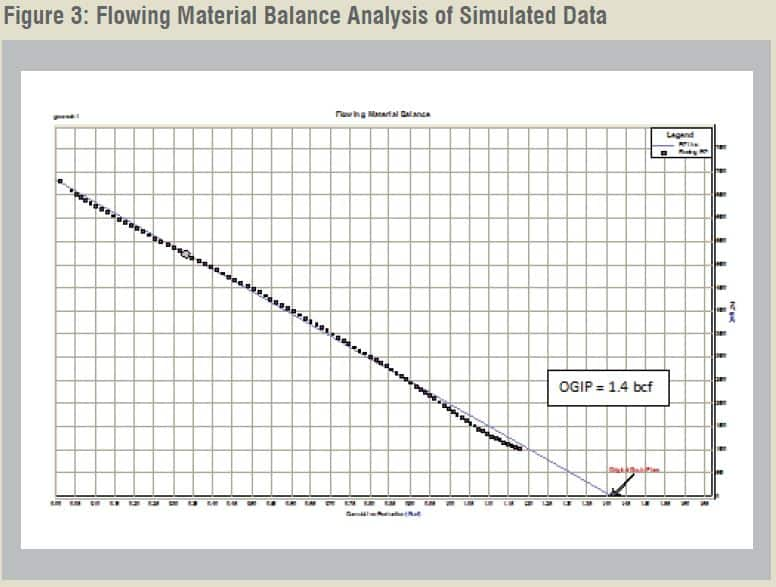
This analysis indicates that the well is draining a limited volume (1.4 bcf). The OGIP for the model was 12 bcf, not 1.4 bcf. Clearly, this interpretation is incorrect, but if that was the only data available, 1.4 bcf would have been our conclusion. Let us consider the same example, but this time, we will include a 10-day buildup, followed by an additional one month of production (similar to a real well's production history), as shown in Figure 4.
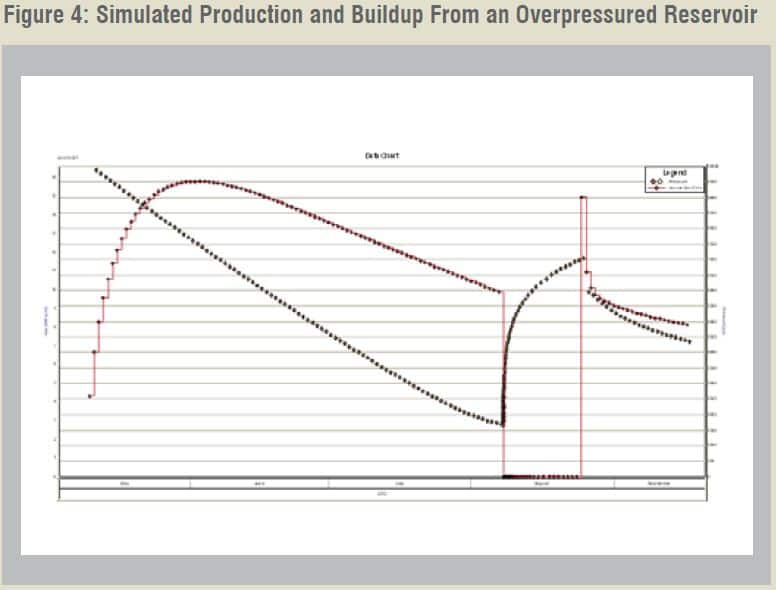
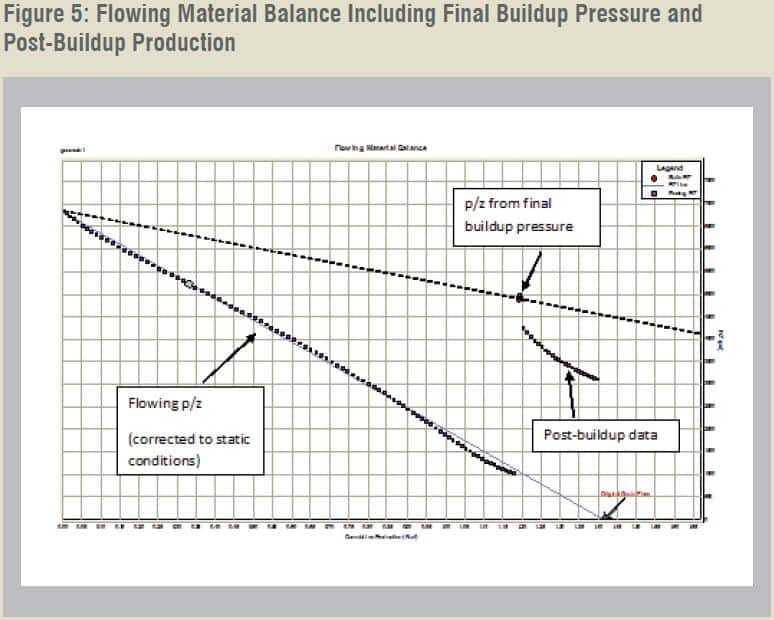
Now, we will include the final buildup data point and post-buildup production data on the FMB plot (Figure 5). What does the graph below tell us? For one thing, it clearly shows an inconsistency (divergence) between the flowing and static pressure trends. It also suggests that the post-buildup well performance has a marked improvement in productivity. It is these kinds of inconsistencies, in actual field cases, that have "raised the red flag" of productivity loss, and brought about the subsequent hypothesis of pressure dependent permeability. If we extrapolate the dotted line (static p/z), we find that the OGIP is 12 bcf, as expected. From this example, it is clear that the flowing and buildup data are both required in order to get a true "sense" of what is going on in the reservoir. Without it, the interpretation is incorrect.
Modeling Pressure Dependent Permeability
As previously stated, pressure dependent permeability can be (and has been) implemented in the analytical reservoir models. This is done by modifying the standard definitions of pseudo-pressure and pseudo-time, to include permeability, as follows:

How can this model be used to assist in the analysis of well performance data? Clearly, well performance analysis cannot be used to predict k(p) directly, in the same manner it is used to predict parameters such as OGIP. Rather, the process is indirect. We first identify the inconsistencies in the analysis, and then use k(p) to try to correct them. It goes without saying that the form of the k(p) function must be determined independently of the production analysis process. The function proposed by Yilmaz and Nur, as described previously appears to be one of several suitable options.
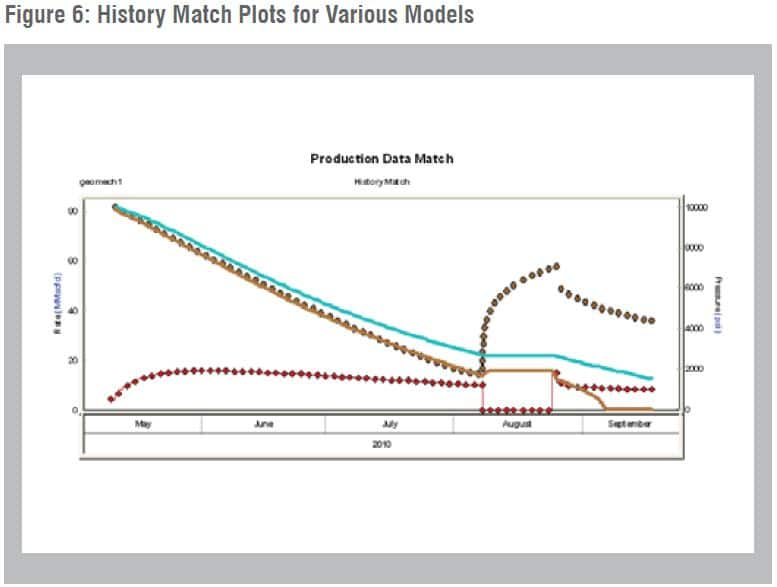
The series of plots (Figure 6) illustrate how the k(p) model can be used in well performance analysis. The first graph shows a model history match based on the production data only. The second shows a model match that honors the final buildup data, but "misses" on the production data, thereby highlighting the inconsistency. The final plot shows a history match that honors all data by including k(p) in the model.


The model shown in the final plot can be used to forecast production. The resulting graph (Figure 7) shows this production forecast. For comparison purposes, a forecast from the "Production Data Match" model is also shown.

The diagnostic plots and models required to perform interpretation and modeling of shales with pressure dependent permeability are all currently available in the IHS RTA software.
David Anderson, Fekete Associates Inc.
Posted 5 May 2016
This article was published by S&P Global Commodity Insights and not by S&P Global Ratings, which is a separately managed division of S&P Global.
{"items" : [
{"name":"share","enabled":true,"desc":"<strong>Share</strong>","mobdesc":"Share","options":[ {"name":"facebook","url":"https://www.facebook.com/sharer.php?u=http%3a%2f%2fssl.ihsmarkit.com%2fcommodityinsights%2fen%2fci%2fresearch-analysis%2frpe-pressure-dependent-permeability-in-overpressured-shales.html","enabled":true},{"name":"twitter","url":"https://twitter.com/intent/tweet?url=http%3a%2f%2fssl.ihsmarkit.com%2fcommodityinsights%2fen%2fci%2fresearch-analysis%2frpe-pressure-dependent-permeability-in-overpressured-shales.html&text=Pressure+dependent+permeability+in+overpressured+shales","enabled":true},{"name":"linkedin","url":"https://www.linkedin.com/sharing/share-offsite/?url=http%3a%2f%2fssl.ihsmarkit.com%2fcommodityinsights%2fen%2fci%2fresearch-analysis%2frpe-pressure-dependent-permeability-in-overpressured-shales.html","enabled":true},{"name":"email","url":"?subject=Pressure dependent permeability in overpressured shales&body=http%3a%2f%2fssl.ihsmarkit.com%2fcommodityinsights%2fen%2fci%2fresearch-analysis%2frpe-pressure-dependent-permeability-in-overpressured-shales.html","enabled":true},{"name":"whatsapp","url":"https://api.whatsapp.com/send?text=Pressure+dependent+permeability+in+overpressured+shales http%3a%2f%2fssl.ihsmarkit.com%2fcommodityinsights%2fen%2fci%2fresearch-analysis%2frpe-pressure-dependent-permeability-in-overpressured-shales.html","enabled":true}]}, {"name":"rtt","enabled":true,"mobdesc":"Top"}
]}