Customer Logins
Obtain the data you need to make the most informed decisions by accessing our extensive portfolio of information, analytics, and expertise. Sign in to the product or service center of your choice.
Customer Logins
BLOG
Dec 02, 2015
Extracting the reservoir signal from production and flowing pressure data: A case study
This project involved the analysis of production and pressure data from a high profile well in East Texas. The well produced 8% H2S from a high deliverability, deep, slightly overpressured gas reservoir. Based on initial wellhead and sandface deliverability calculations, the wellhead deliverability was restricted by the 2 ½ inch ID tubing. Even so, the well produced at a controlled rate of 18 MMscf/d (plant capacity) using a variable choke at surface. The well easily maintained the contract rate for the first four months of production but the operator was concerned about a rapid deterioration in wellhead flowing pressure. From "point-in-time" deliverability calculations, IHS determined that wellhead deliverability could be increased by using a 3 ½ inch tubing string. However, without confirmation of economic reserves, the operator was understandably reluctant to purchase a 3 ½ inch tubing string. The value of having a reliable OGIP estimate would have helped the client make the decision to purchase the larger tubing string and increase the well's production.
The first IHS RTA evaluation was performed in August, 2003, after about four months of production. A type curve match using the Blasingame analysis showed a data "smear" with no clear trend (See Fig. 1).

A simulation model was created in an attempt to match the observed pressure history, but it was not successful. The rapidly declining flowing pressure trend suggested a limited reserve area (roughly 5 Bcf), but a shut-in period showed a rapid return to near virgin reservoir pressure. The results of the analysis seemed to indicate significant and progressive pressure loss in or near the well. This pressure loss effectively masked the high deliverability reservoir response. The IHS RTA evaluation at that time could not estimate the OGIP with any degree of certainty.
In February 2004 the analysis was revised but, again, the observed flowing pressure history showed a repetitive pattern of rapidly declining productivity, followed by an abrupt restoration to near original pressure level upon shut-in. Matching the pressure behavior using simulation or type curve analysis could not be done reliably with the initial data set. Fortunately, a capillary injection string ("cap string") with a bottomhole check valve had been installed in October 2003. This opened a direct hydraulic connection to the flowing bottomhole conditions, without the need to deal with the unknown component of friction losses. Using pressures measured at the injection point on surface, the bottomhole flowing pressures could be calculated with a high degree of confidence by simply adding the hydrostatic pressure loss due to a column of known fluid in the injection string. The production and pressure data history is shown in Fig. 2.

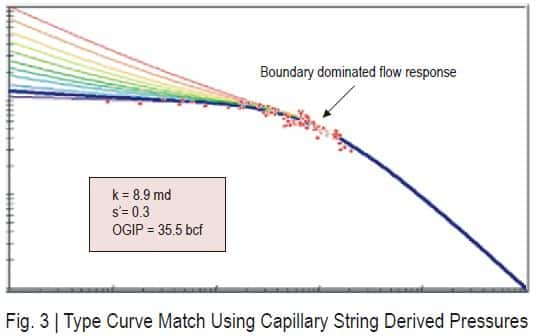
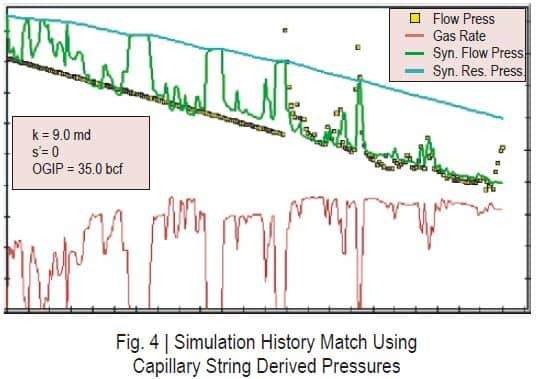
With the newly discovered data source, a type curve match was performed and yielded meaningful results. As evident from Fig. 3, a clear boundary dominated trend emerged. The interpreted OGIP turned out to be higher than anyone had expected, in the order of 35 Bcf. A simulation history match (Fig. 4) confirmed the results, with the flowing pressure trend being matched with high precision. Upon viewing the results, the operator decided to change-out the tubing string.
The resulting well performance has thus far confirmed the results of the revised IHS RTA study. Without the methods of advanced production decline analysis, which use rates and flowing pressures together, there would have been no reliable way to predict OGIP. The decision to go with a larger tubing string could not be justified, initially, because stabilized shut-in pressures were not measured during the well's production history. Only after an advanced production decline analysis was performed with IHS RTA could the decision to purchase a 3 ½ inch tubing string be justified.
David Anderson, Fekete Associates Inc.
Posted 12 April 2016
This article was published by S&P Global Commodity Insights and not by S&P Global Ratings, which is a separately managed division of S&P Global.
{"items" : [
{"name":"share","enabled":true,"desc":"<strong>Share</strong>","mobdesc":"Share","options":[ {"name":"facebook","url":"https://www.facebook.com/sharer.php?u=http%3a%2f%2fssl.ihsmarkit.com%2fcommodityinsights%2fen%2fci%2fresearch-analysis%2frpe-extracting-the-reservoir-signal-from-production-and-flowing-pressure-data-a-case-study.html","enabled":true},{"name":"twitter","url":"https://twitter.com/intent/tweet?url=http%3a%2f%2fssl.ihsmarkit.com%2fcommodityinsights%2fen%2fci%2fresearch-analysis%2frpe-extracting-the-reservoir-signal-from-production-and-flowing-pressure-data-a-case-study.html&text=Extracting+the+reservoir+signal+from+production+and+flowing+pressure+data%3a+A+case+study","enabled":true},{"name":"linkedin","url":"https://www.linkedin.com/sharing/share-offsite/?url=http%3a%2f%2fssl.ihsmarkit.com%2fcommodityinsights%2fen%2fci%2fresearch-analysis%2frpe-extracting-the-reservoir-signal-from-production-and-flowing-pressure-data-a-case-study.html","enabled":true},{"name":"email","url":"?subject=Extracting the reservoir signal from production and flowing pressure data: A case study&body=http%3a%2f%2fssl.ihsmarkit.com%2fcommodityinsights%2fen%2fci%2fresearch-analysis%2frpe-extracting-the-reservoir-signal-from-production-and-flowing-pressure-data-a-case-study.html","enabled":true},{"name":"whatsapp","url":"https://api.whatsapp.com/send?text=Extracting+the+reservoir+signal+from+production+and+flowing+pressure+data%3a+A+case+study http%3a%2f%2fssl.ihsmarkit.com%2fcommodityinsights%2fen%2fci%2fresearch-analysis%2frpe-extracting-the-reservoir-signal-from-production-and-flowing-pressure-data-a-case-study.html","enabled":true}]}, {"name":"rtt","enabled":true,"mobdesc":"Top"}
]}