Customer Logins
Obtain the data you need to make the most informed decisions by accessing our extensive portfolio of information, analytics, and expertise. Sign in to the product or service center of your choice.
Customer Logins
BLOG
Feb 21, 2018
Ranking Well Performance - Does Flowing Pressure Matter?

How should we rank wells?
The main measurement of a well’s value is its Net Present Value (NPV). The revenue portion of NPV is directly related to discounted production over the life of the well — its discounted production to Expected Ultimate Recovery (discounted EUR). A correct ranking of well production performance is a ranking based on discounted EUR.
How are wells commonly ranked?
An often used, convenient way to rank well performance is to use short term production metrics such as IP (Initial Production), 30-day, 60-day, or 90-day cumulative production. It is convenient, because soon after the well is put on production, you have enough data to calculate and compare. The bad news is that these metrics aren’t necessarily indicative of what we are after, that is, discounted EUR.
The diagram below depicts the problem. If we rank wells based on their short term production, for example 30-day cum production, is that really indicative of how they would rank based on discounted EUR?

Figure 1 – Depiction of ranking wells based on short term metrics in relation to ranking based on discounted EUR
We can answer this question graphically by plotting the rank of 30-day cum vs. discounted EURi . I have done this below for a 299 oil well dataset in a major US shale play. A perfect ranking would exhibit increasing monotonic data on this plot (no scatter). It is clear that this is not the case and that there is a very weak correlation between the ranking of 30-day cum and discounted EUR. This is not news to most petroleum engineers, and has been well documented by others in the industryii. Nevertheless the industry continues to ignore the problem. In some cases, wells may be overvalued, where in other cases they may be undervalued.
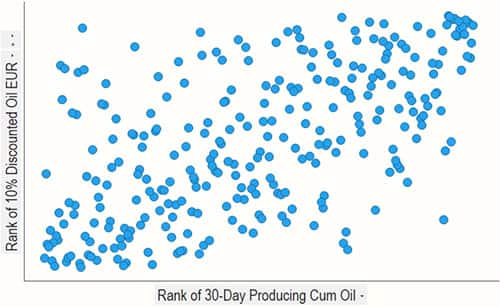
Figure 2 – Rank plot of 30-day cum oil vs. discounted EUR
Why isn’t short-term production indicative of longer term performance?
There are many reasons, but they can be broken down into different categories, such as Subsurface, which includes both the rock and the completion, and Operations. Variance in subsurface conditions among wells, such as stress dependent productivity and accessible hydrocarbons in place, have a significant effect on the relationship between short term and long term performance.
Perhaps one of the most neglected factors is the influence of operating pressure on early time production rates. Simply put, the harder you drawdown the well (lower the flowing pressure), the larger the rate. It’s an easy way to make one well look better than another in the short-term.
How variable is short-term drawdown?
For the same wells, I’ve plotted a histogram of drawdown for the first 90 days of production. Drawdown in this play varies by +/- 40% (standard deviation).
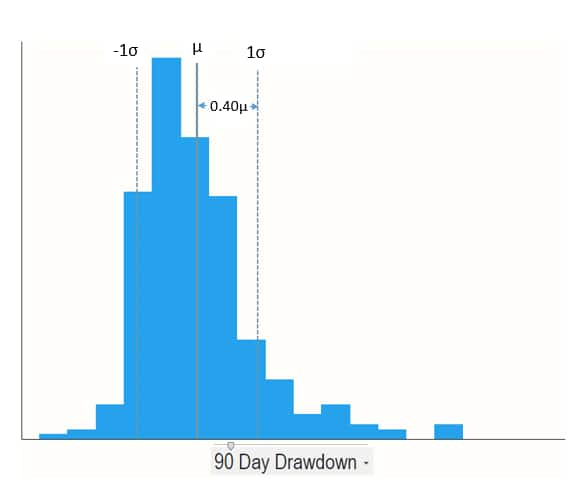
Figure 3 – Histogram of 90 day drawdown
So how does this affect short term metrics? Below, I’ve plotted 3-year discounted cum oil vs 90-day cum, and colored wells based on drawdown. I’ve chosen 3-year cum as a proxy to EUR because it is an indisputable value (EUR must be predicted). Wells on higher drawdown tend to land below the best fit line, while wells on lower drawdown tend to land above the best fit line. The same information is plotted in a histogram where we see low drawdown wells biased to the right and high drawdown biased to the left.
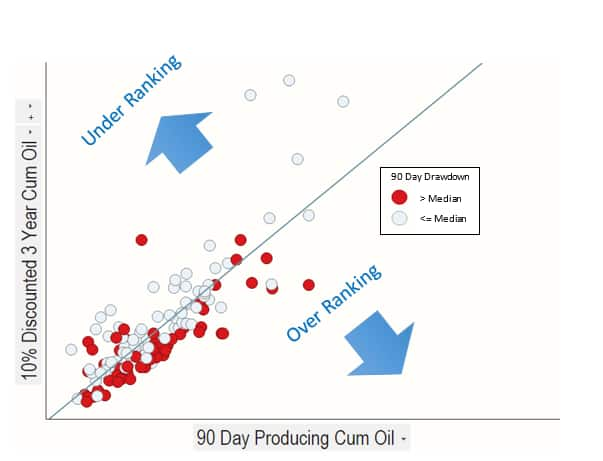
Figure 4: Cross plot of 90 day cumulative oil production vs. discounted 3 year cumulative oil production.
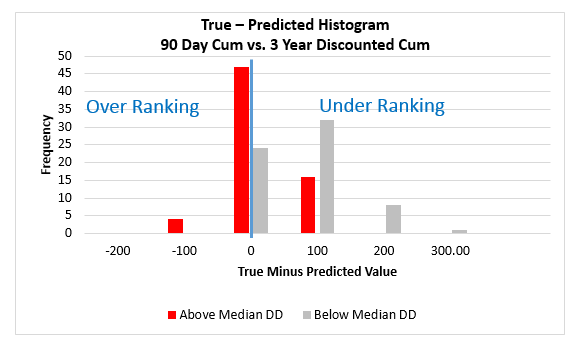
Figure 5: Histogram of actual 3 year cumulative production minus that predicted by the best fit line in Figure 4.
What this tells us is that ranking based on short term production metrics tends to over predict the value of wells that were on high drawdown while under predicting the value of wells that were on low drawdown. There is no reason to do this. In fact, in many unconventional plays, high drawdown at early time can be detrimental to long term well performance (due to high stresses induced on the completion). So rewarding high-drawdown is if anything, the opposite of what one should do.
Can we eliminate drawdown bias?
One way to eliminate the bias is to normalize by drawdown. Linear Flow Productivity index is a physics-based metric that includes drawdown normalization. It is related to q/Dp, where q is the production rate and Dp is the drawdown. It is simple to calculate, and requires minimal information. Comparing the histogram below to the one above, we can see that drawdown bias is eliminated. Wells that were on high drawdown behave similarly to wells that were on low drawdown.
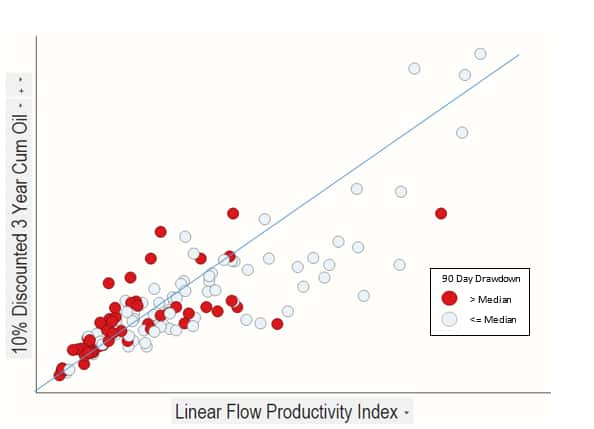
Figure 6: Cross plot of linear flow productivity index vs. discounted 3 year cumulative oil production.
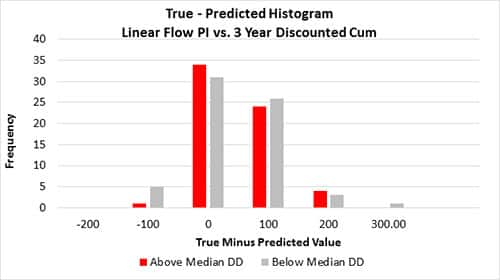
Figure 7: Histogram of actual 3 year cumulative production minus that predicted by the best fit line in Figure 6.
Beyond Short-Term Metrics
In this study, we have demonstrated that short-term rate/volume metrics are subject to drawdown bias. We also demonstrated that pressure normalization can be used to eliminate this bias.
The above was used to demonstrate the concept of drawdown bias, not as a recommended approach to predict EUR. Better predictions can be obtained using a combination of analysis and predictive modelling techniques that take into account important factors such as well spacing, stage spacing, geomechanics and fluid effects.
IHS Markit Harmony Enterprise contains a set of easy-to use tools with a wide range of applicability to help you determine EUR of wells, where the best wells are located and what affects their productivity.
This article is based on the paper “Does Flowing Pressure Matter? A Statistical Study”, presented at the 2017 Unconventional Resources Technology Conference (URTeC) in Austin, TX.
Dylan Lougheed is Product Director for Reservoir Engineering Solutions at IHS Markit.
iEURs generated using a physics-based forecasting technique as described in (Anderson & Liang, 2011)
ii“How useful are IP30, IP60, IP90 … initial production measures?” (Groulx, 2015)
Anderson, D., & Liang, P. (2011, January 1). Quantifying Uncertainty in Rate Transient Analysis for Unconventional Gas Reservoirs. Society of Petroleum Engineers. doi:10.2118/145088-MS
Groulx, B. (2015, 6 15). How useful are IP30, IP60, IP90 … initial production measures? Retrieved from Verdazo: http://www.verdazo.com/blog/how-useful-are-ip30-ip60-ip90-initial-production-measures/
Lougheed, D., Khaksarfard, R., & Anderson, D. (2017, July 24). Does Flowing Pressure Matter? A Statistical Study. Unconventional Resources Technology Conference.
This article was published by S&P Global Commodity Insights and not by S&P Global Ratings, which is a separately managed division of S&P Global.
{"items" : [
{"name":"share","enabled":true,"desc":"<strong>Share</strong>","mobdesc":"Share","options":[ {"name":"facebook","url":"https://www.facebook.com/sharer.php?u=http%3a%2f%2fssl.ihsmarkit.com%2fcommodityinsights%2fen%2fci%2fresearch-analysis%2franking-well-performance.html","enabled":true},{"name":"twitter","url":"https://twitter.com/intent/tweet?url=http%3a%2f%2fssl.ihsmarkit.com%2fcommodityinsights%2fen%2fci%2fresearch-analysis%2franking-well-performance.html&text=Ranking+Well+Performance+-+Does+Flowing+Pressure+Matter%3f","enabled":true},{"name":"linkedin","url":"https://www.linkedin.com/sharing/share-offsite/?url=http%3a%2f%2fssl.ihsmarkit.com%2fcommodityinsights%2fen%2fci%2fresearch-analysis%2franking-well-performance.html","enabled":true},{"name":"email","url":"?subject=Ranking Well Performance - Does Flowing Pressure Matter?&body=http%3a%2f%2fssl.ihsmarkit.com%2fcommodityinsights%2fen%2fci%2fresearch-analysis%2franking-well-performance.html","enabled":true},{"name":"whatsapp","url":"https://api.whatsapp.com/send?text=Ranking+Well+Performance+-+Does+Flowing+Pressure+Matter%3f http%3a%2f%2fssl.ihsmarkit.com%2fcommodityinsights%2fen%2fci%2fresearch-analysis%2franking-well-performance.html","enabled":true}]}, {"name":"rtt","enabled":true,"mobdesc":"Top"}
]}