Customer Logins
Obtain the data you need to make the most informed decisions by accessing our extensive portfolio of information, analytics, and expertise. Sign in to the product or service center of your choice.
Customer Logins
BLOG
Aug 03, 2020
Life Cycle Analysis- a Process Based Methodology

Life cycle analysis of an energy or chemical product calls for accounting for cumulative carbon emission of each process step from an oil well, gas well, coal mine, salt deposit, or any starting point of a natural resource to the end of life for each ton of final product.
The task is very daunting since in each process step along a value chain they are several competing processes. Within each process, if there are several co-products such as in a refinery or naphtha steam cracker, the total emission needs to be allocated to each individual product in a consistent way. Pushing upstream, every well has different depth and production method such as conventional well or horizontal drilling with fracking, the carbon footprint for each barrel of oil can vary widely. Each barrel of oil also needs to be transported. Carbon footprint will be different for each barrel when it arrives at a refinery, depending on transportation methods and distance. Carbon footprint from gas wells will be subject to similar variations. Carbon footprint for the same value chain also vary by region and change with time.
Given all the possible variations and its complexity, life cycle analysis requires rigorous methodology, consistency, detailed datasets and transparency, particularly because life cycle analysis is often used to benchmark the sustainability of competing products. We will use production of PET (polyethene terephthalate) starting from ethane steam cracking to produce ethylene, as a segment of total life cycle analysis, to show how the rigor and transparency can be achieved and extended to the whole life cycle. The selection of PET is most relevant for the life cycle discussion since the plastic is used for making water bottles. Its sustainability is often subjected to heated debates.
The following figure illustrate the PET value chain with a set of chosen processes. It also indicates the unit consumption of each major raw material along the value chain for producing one ton of PET.
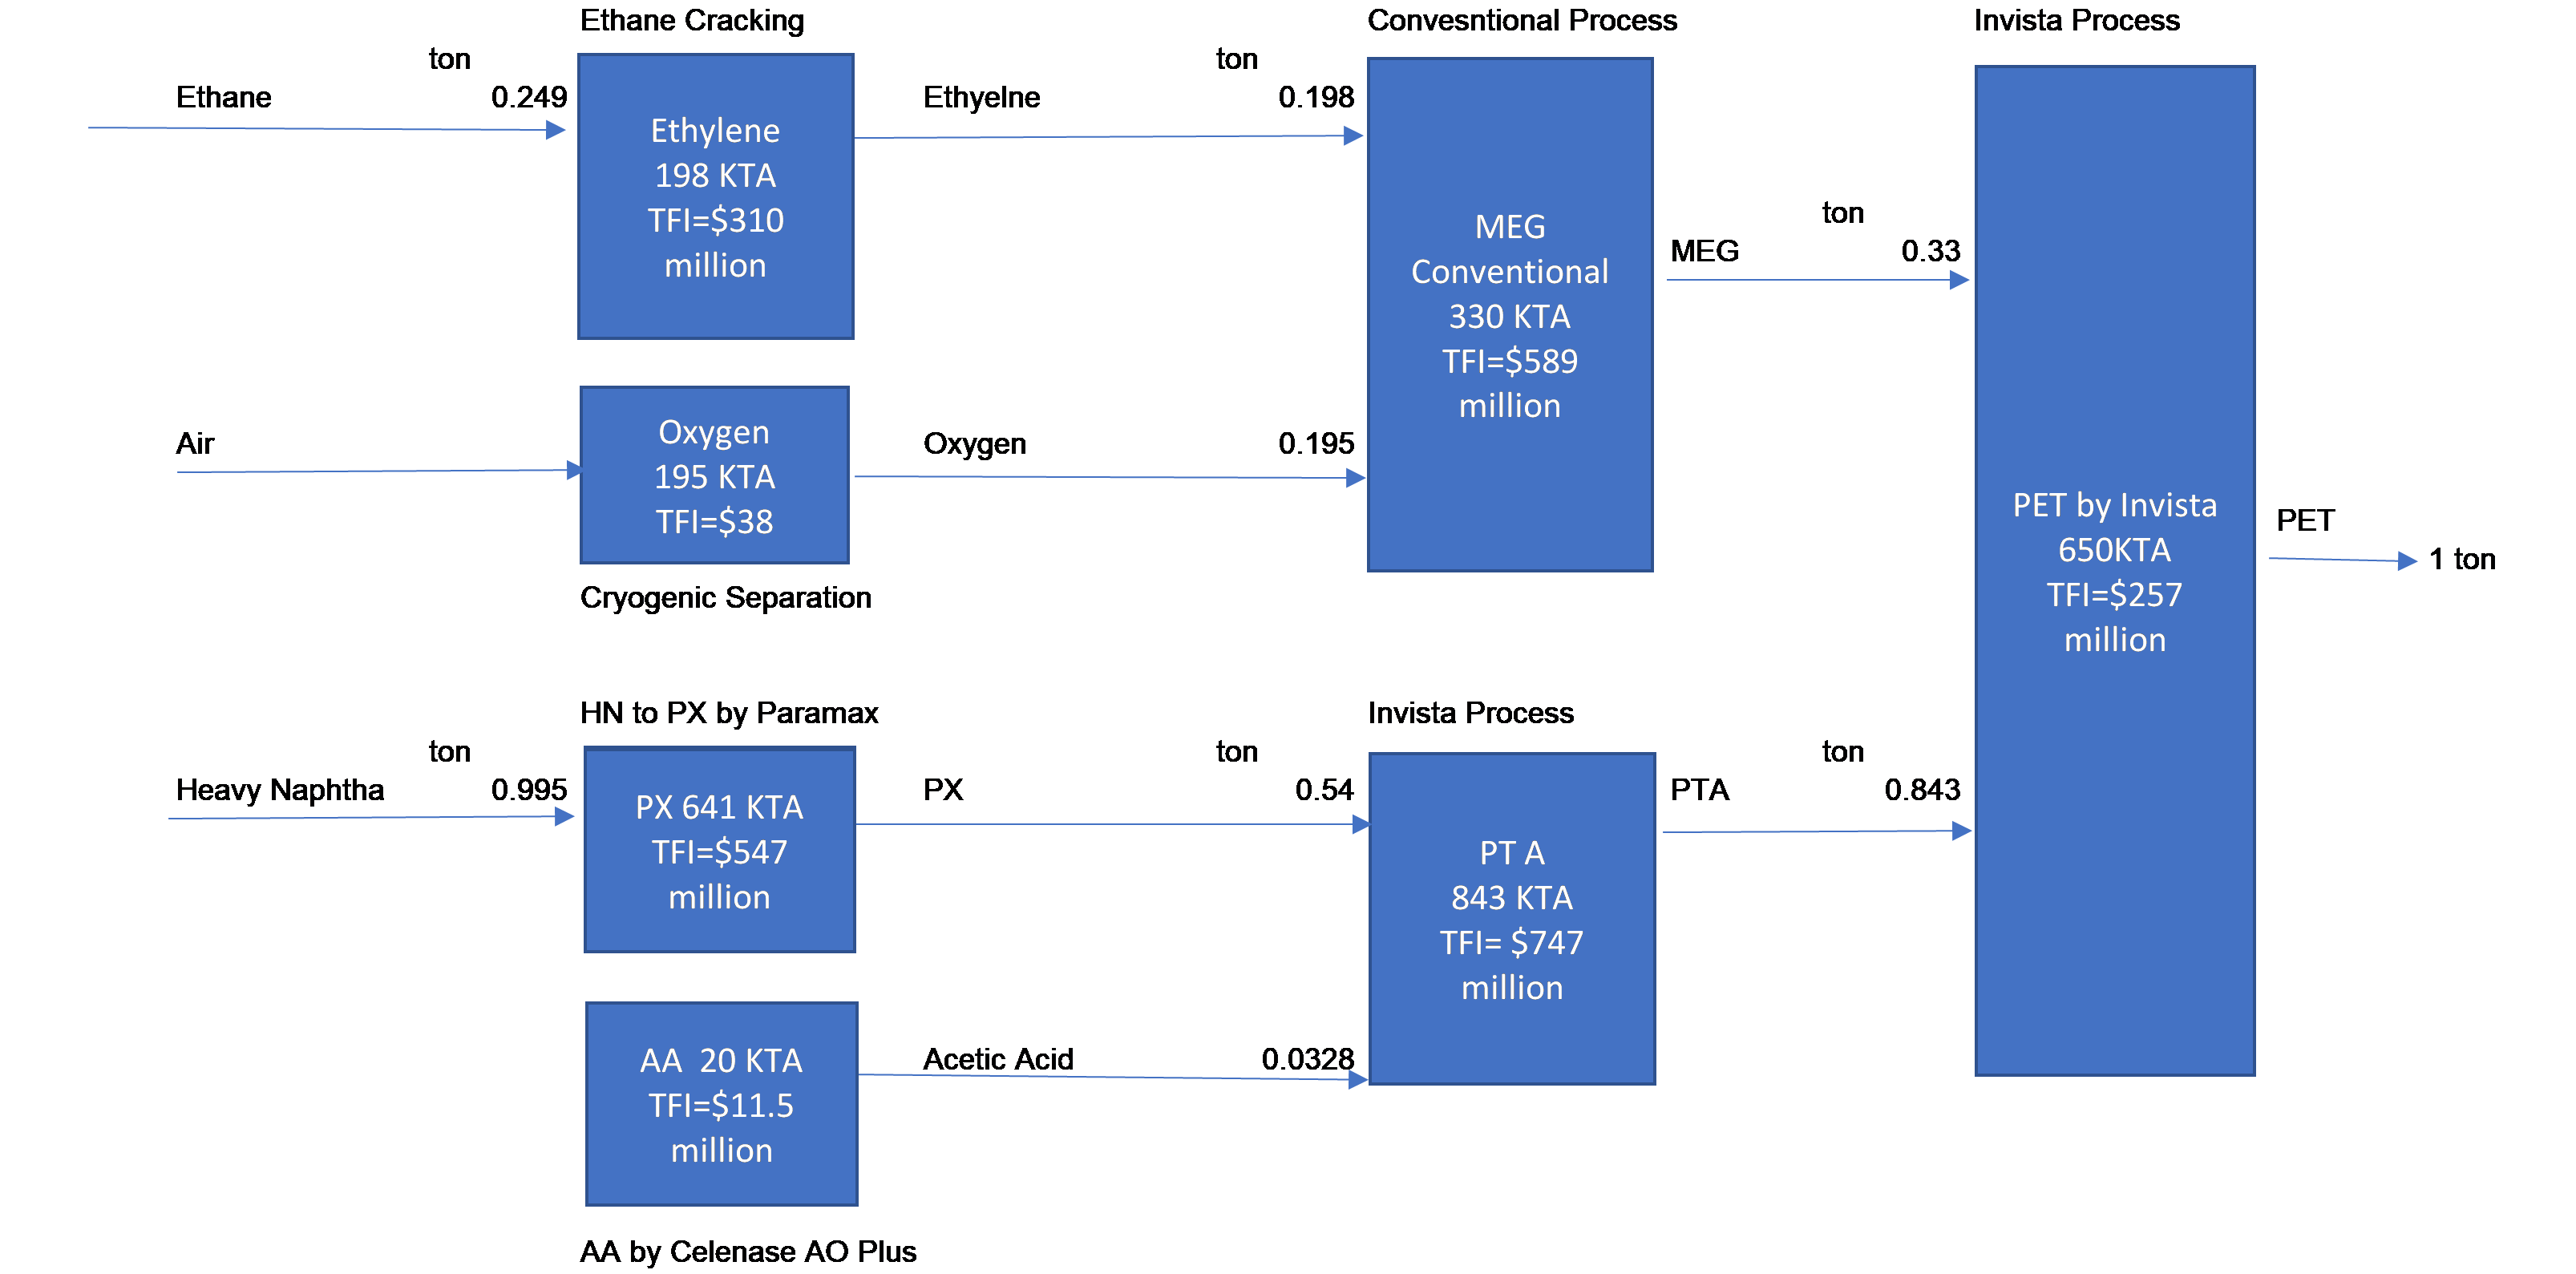
- Direct process CO2 emissions from the reaction itself. Direct process emission does not change with location or time.
- Direct fuel CO2 emissions from fuel consumption in furnaces and steam boilers. Although the total energy requirement for a process is the same, fuel emissions can change with location since each region use different fuels, which will have different carbon footprint per MMBtu of energy. However, it does not change with time.
- Indirect process CO2 emissions from electricity consumption. Even with the same electricity consumption for each process, CO2 emission per kwh from each region will be different depending on the fuel mix for generating electricity in each region. As each region is moving towards greener electricity production such as solar or wind, the carbon emission per kwh of electricity in most regions has decreased. Thus, the indirect emission from electricity changes with location and time.
The carbon footprint of each process is first determined based on the production of one ton of each intermediate chemical along the value chain. Based on the unit consumption, carbon footprint of each chemical is then converted to per ton of PET basis. The total carbon footprint per ton of integrated PET production, which is 2.21 t CO2/ t of PET, is the sum of contributing carbon footprint from all intermediate chemicals, as shown in the following figure.
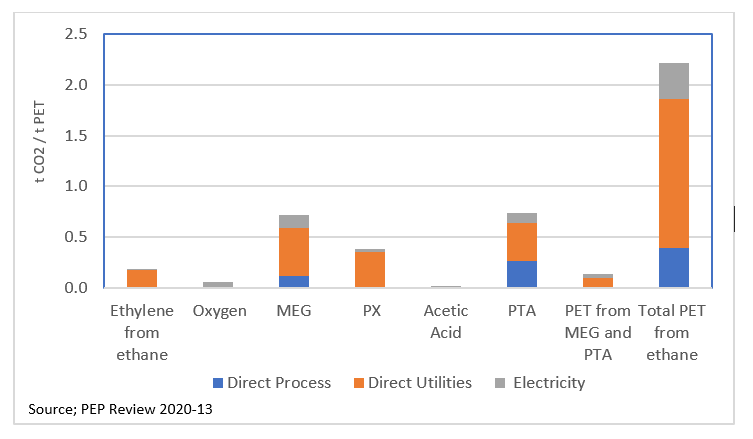
Three components of carbon footprint in each process and their build-up along the value chain are clearly tracked, showing the rigor and transparency of the methodology. This will allow the carbon footprint adjustment for other regions due to difference in the process fuel and fuel mix for electricity generation.
Carbon footprint (and life cycle) analysis needs to be process specific. There are many competing technologies in the production of each chemical in the value chain. One can switch a chosen process to a competing process and work out the carbon footprint using the alternate technologies with unit consumptions appropriately adjusted. This includes changing feedstock of some process. For example, one can replace ethylene production from ethane steam cracking to wide range naphtha steam cracking which is more prevalent in Europe and China.
In the value chain presented above, each process produces a dominant product, and the carbon footprint of the process is totally allocated to the main product alone. This introduces a small quantifiable error. But when naphtha is used as feedstock to produce ethylene in a steam cracker, with one ton of ethylene it typically produces 0.5 tons of propylene, 0.35 tons of C4 fraction, and 0.55 tons of pyrolysis gasoline, etc. If the carbon footprint is assigned to ethylene alone, error will be very substantial. How to fairly allocate the total carbon footprint to each product is a major issue in the light cycle analysis. The issue becomes even more complicated in a refinery where typically over 15 products are produced in large quantity, including various fuels and chemicals. Each product is derived from several process units in the refinery. Even in these multiple-product process units, the methodology introduced for integrated PET production still can be applied. Key is to accurately determine the energy and electricity consumption in all process units associated with each product to appropriately allocate carbon footprint to each product. It will be much more complex, but it can be done.

carbon footprint of the PET value chain starting from delivered basic feedstock ethane and wide range naphtha, life cycle analysis needs to include carbon footprint from oil or gas wells to a refinery or gas processing plant. Although there is a lot more work that can be done in this space, some existing tools that can provide some guidance includes GREET® (The Greenhous Gases, Regulated Emissions, and Energy use in Transportation) model developed by Argonne National Laboratory of Department of Energy and OPGEE® (The Oil Production Greenhouse Gas Emissions Estimator) model by Stanford University and PRELIM (Petroleum Refinery Life Cycle Inventory Model) from the University of Calgary. These models can provide well level estimates of carbon footprint from well production and transportation. However, because no two wells are the same, and the data requirements extension, there can be large variations in emissions and reliability of estimates. Indeed, high variability in the natural resource excavation (or mining) and transportation posts another major uncertainly in the life cycle analysis. For life cycle analysis of a plastic also need to include carbon footprint of downstream conversion processes such as extrusion, injection molding, or blow molding, etc.
In summary, to be creditable, life cycle analysis must be based on detailed material and balance of each process from cradle to grave for deriving the three main components of carbon emission: direct process emission, direct fuel emission, and indirect electricity, that will allow adjustment to different regions due to difference in processing fuels and fuel-mix used for electricity generation. The allocation methodology of carbon footprint in a multiple-product process needs to be rigorous and transparent. When life cycle includes natural resource excavation and transport, the inherent high variability should be recognized.
{"items" : [
{"name":"share","enabled":true,"desc":"<strong>Share</strong>","mobdesc":"Share","options":[ {"name":"facebook","url":"https://www.facebook.com/sharer.php?u=http%3a%2f%2fssl.ihsmarkit.com%2fcommodityinsights%2fen%2fci%2fresearch-analysis%2flife-cycle-analysis-a-process-based-methodology.html","enabled":true},{"name":"twitter","url":"https://twitter.com/intent/tweet?url=http%3a%2f%2fssl.ihsmarkit.com%2fcommodityinsights%2fen%2fci%2fresearch-analysis%2flife-cycle-analysis-a-process-based-methodology.html&text=Life+Cycle+Analysis-+a+Process+Based+Methodology+%7c+S%26P+Global+","enabled":true},{"name":"linkedin","url":"https://www.linkedin.com/sharing/share-offsite/?url=http%3a%2f%2fssl.ihsmarkit.com%2fcommodityinsights%2fen%2fci%2fresearch-analysis%2flife-cycle-analysis-a-process-based-methodology.html","enabled":true},{"name":"email","url":"?subject=Life Cycle Analysis- a Process Based Methodology | S&P Global &body=http%3a%2f%2fssl.ihsmarkit.com%2fcommodityinsights%2fen%2fci%2fresearch-analysis%2flife-cycle-analysis-a-process-based-methodology.html","enabled":true},{"name":"whatsapp","url":"https://api.whatsapp.com/send?text=Life+Cycle+Analysis-+a+Process+Based+Methodology+%7c+S%26P+Global+ http%3a%2f%2fssl.ihsmarkit.com%2fcommodityinsights%2fen%2fci%2fresearch-analysis%2flife-cycle-analysis-a-process-based-methodology.html","enabled":true}]}, {"name":"rtt","enabled":true,"mobdesc":"Top"}
]}