Customer Logins
Obtain the data you need to make the most informed decisions by accessing our extensive portfolio of information, analytics, and expertise. Sign in to the product or service center of your choice.
Customer Logins
BLOG
May 10, 2019
Impact of decline parameters on your expected ultimate recoverable reserves
The Estimated Ultimate Recovery (EUR) is one of the most important attributes typically calculated in unconventional wells (horizontal fractured wells in resource plays). EUR is defined as the projected hydrocarbons recovery across the well lifecycle, until it is abandoned, and that number forms the basis for many economic projections, and directly impacts reserves, type curves, budgets and any technical assessment which operating companies disclose publicly to investors. It's also one of the most common benchmarks used for evaluating the performance of a company in a given basin.
There is not a single correct way to calculate EUR; several models and methods are available. The most common method involves fitting a decline curve on the well production history and extrapolating it until reaching an expected abandonment time (or conversely, an abandonment rate as an economic limit of the well).
Production forecasting is subject to large uncertainties, especially in unconventional reservoirs. As outlined as recently as January 2019 by Wall Street Journal article<span/>: "Fracking's secret problem-Oil wells aren't producing as much as forecast"by Bradley Olson, Rebecca Elliott and Christopher M. Matthews, this is one of the most relevant topic investors are currently looking at in US Onshore, as it affects the sustainability and economic profitability of the most important unconventional plays.
One of the challenges involves the limited extension of production data. As completion designs are quickly evolving, we only have a limited amount of historical data (e.g. older wells have "old" completions, typically smaller frac jobs) but we need to predict decades into the future, hence, assumptions must be made on the long-term production behavior of the wells.
In order to further explore which factors affect the predicted EURs, let's review an example. Using Enerdeq as the source of production data, we have selected 48 wells completed in 2016 by one operator, with similar lateral lengths and completed in the same formation within the Delaware Basin.
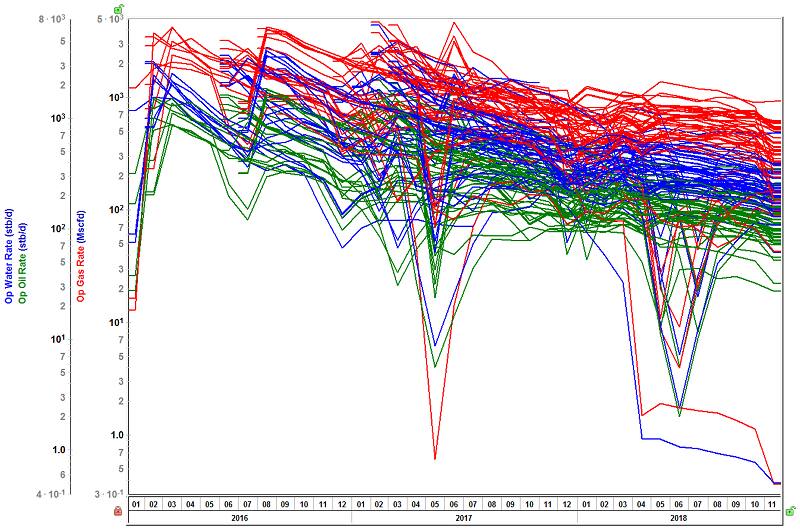
Figure 1: Production history of wells selected in the study
As it can be seen in Figure 1, the sample wells have more than 2 years of data. In this case, this length of production history allows for a clear trend in the decline performance, allowing us to apply a reasonable decline match on the trend observed. The forecast, however, will depend on the variables that we will be testing next. Using Harmony Forecast, a component of the Harmony Enterprise platform, it takes just minutes to add a decline curve to all wells and obtain an EUR estimate. Figure 2 illustrates this process. We used the modified hyperbolic method; although more sophisticated models are available in this software, we wanted to use a relatively simple DCA method which is widely used in the industry.
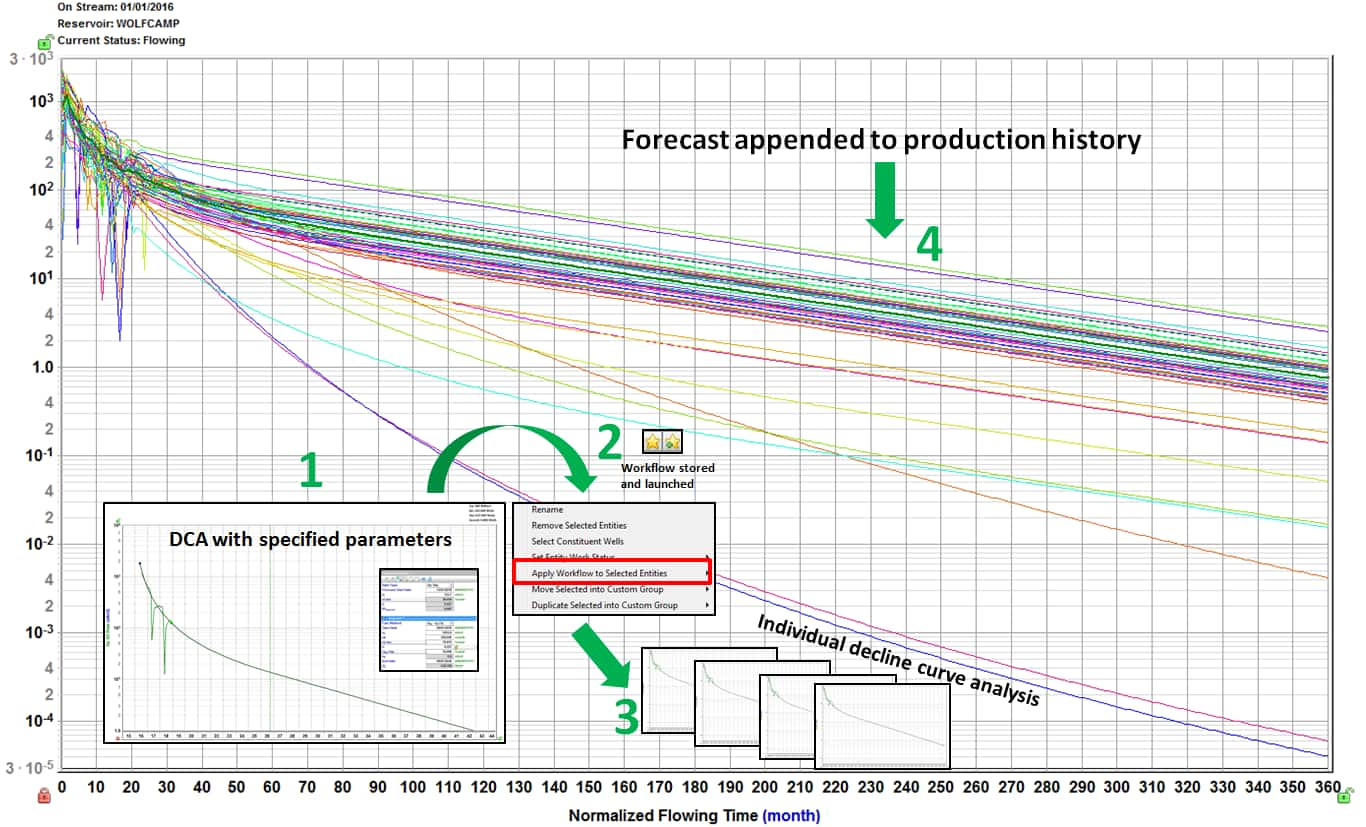
Figure 2: Process to obtain the EUR's in Harmony Forecast.
Our base case forecast is a prediction of all wells' production to 30 years, using a terminal decline of 5% (e.g. the terminal decline appends an exponential tail to the hyperbolic curve).
Although the hyperbolic model fit is non-unique (e.g. it's easy to get multiple matches with different fit values), there is even larger uncertainty in the late time behavior, especially because we have no data to validate it. We performed a sensitivity study on two parameters: the abandonment time of the wells, and the magnitude of the terminal decline.
Table 1 shows the summary results for our 48 wells study group, when changing abandonment time. Comparing versus the base case (30 years), a 15 year forecast reduces the median EUR in by 12%, while extending the well life to 40 years increases EUR by 4% (it's worth noting that some operators assume an even longer well life). This table also shows P10/P90 ratios discussed in Monograph 3 by SPEE (Society of Petroleum Evaluation Engineers) as a measure of uncertainty. As it can be observed, the outcome of these cases has a low variance (with ratios between 2 and 5) reassuring that a good selection of analog wells was carried out. The higher the P10/P90 ratio is, the greater is the uncertainty in a projects outcome, such is the case of higher risk projects that exhibit ratios of more than 25.
Also reported in Table 1 is Average EUR/lateral foot of the wellbore. Reserves evaluators and reservoir engineers often relate the average reserves per feet (Avg EUR/ft) when working with large population of wells in a given area. Most of the time this serves as a key performance indicator (KPI) to run economic analyzes.

Table 1: EUR summary results (abandonment time
sensitivity)
Figure 3 shows the cumulative frequency distribution plot of the resulting EUR values in each case, and Figure 4, compares the frequencies indicating a general shift to the right as the well life is larger (E.g. larger EUR), but also the distribution gets a bit wider (outlined as and increased P10/P90 ratio, from 2.14 for 15 years to 2.37 for 40 years). Median EUR normalized per lateral length ranged from 94 to 110 MSTB.
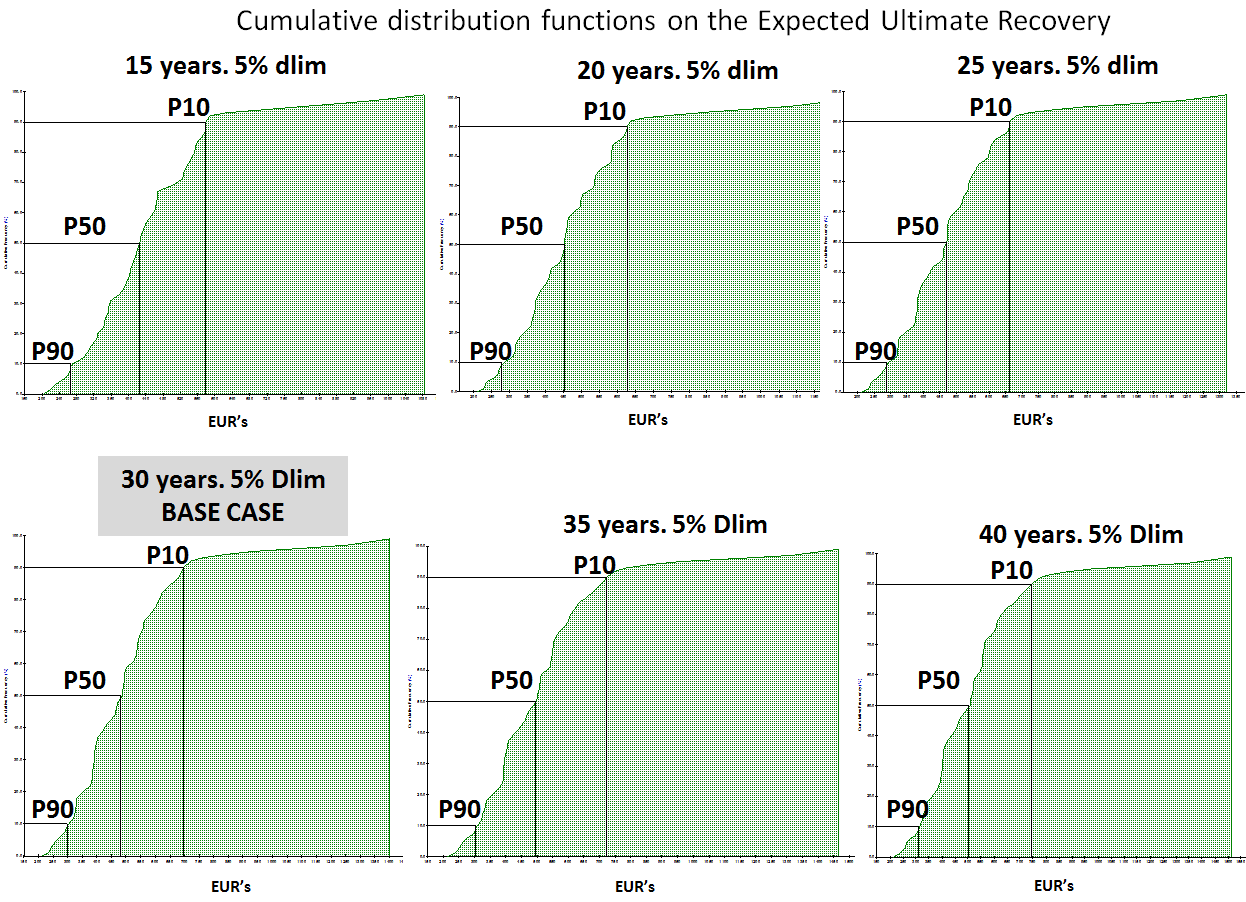
Figure 3: EUR Cumulative distribution functions in Harmony Forecast (Sensitivities on abandonment time)
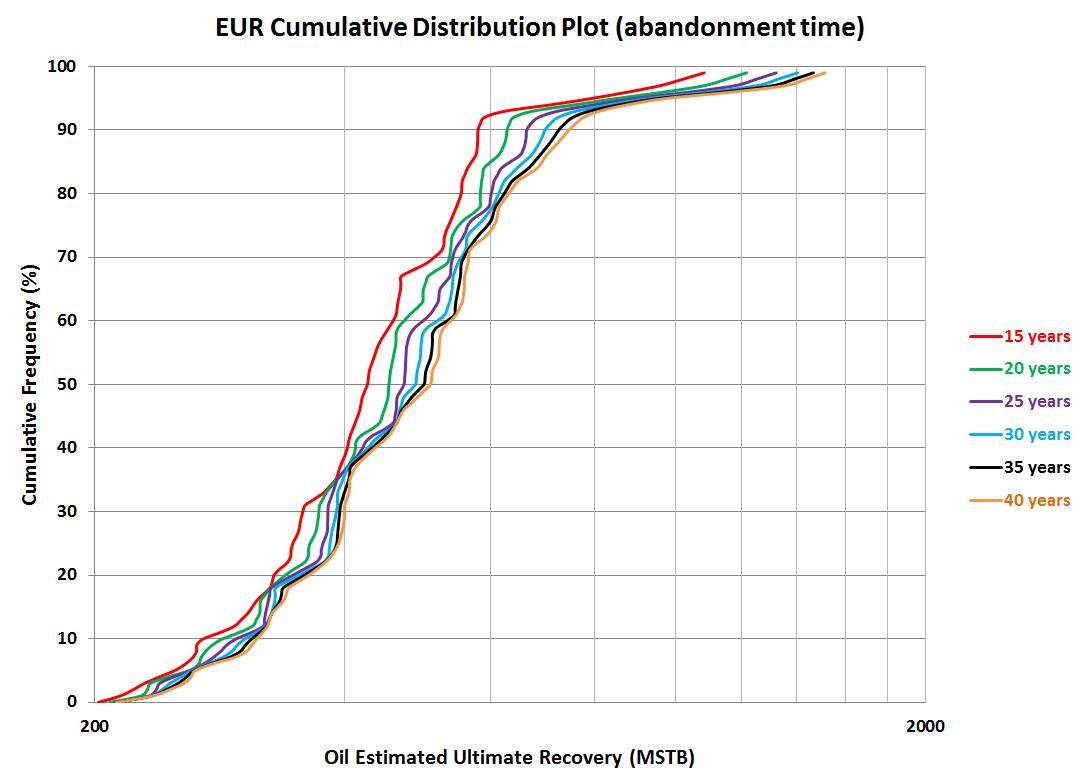
Figure 4: EUR comparison (Sensitivities on abandonment time)
Table 2, Figures 5 and 6 show similar results, in this case changing the terminal decline (Dlim) as a sensitivity, increased from 5% to 15% (e.g. a larger terminal decline produces <span/>an earlier decline in the forecast, while maintaining a common abandonment time of 30 years. Larger Dlim values reduce EUR, up to a 10% median EUR reduction when using a 15% Dlim compared to our base case, and also the EUR distribution gets tighter (illustrated by a P10/P90 ratio reduction from 2.29 to 2.11). Although most companies use Dlim values in the 5-10% range for liquid-rich plays, it has been previously suggested in literature and industry forums that these values can be as high as the ranges considered in our example. In this case we used the same approach as to the one in the case above to obtain the average reserves per feet (Avg EUR/ft). We normalized reserves per individual lateral length and calculated the average reserves per feet to all the cases when we varied the Dlim.

Table 2: EUR summary results (terminal decline sensitivity)
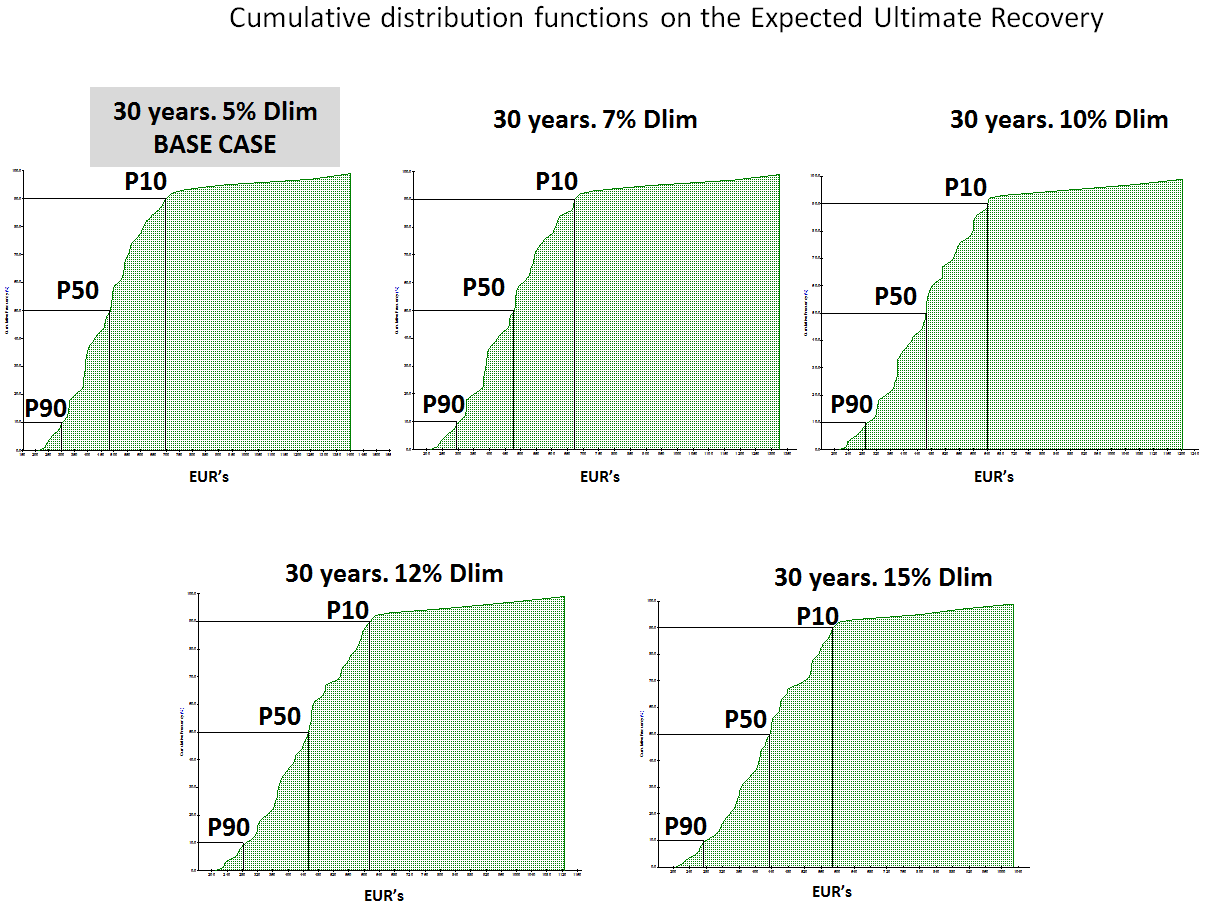
Figure 5: EUR Cumulative distribution functions in Harmony Forecast (Sensitivities on terminal decline)
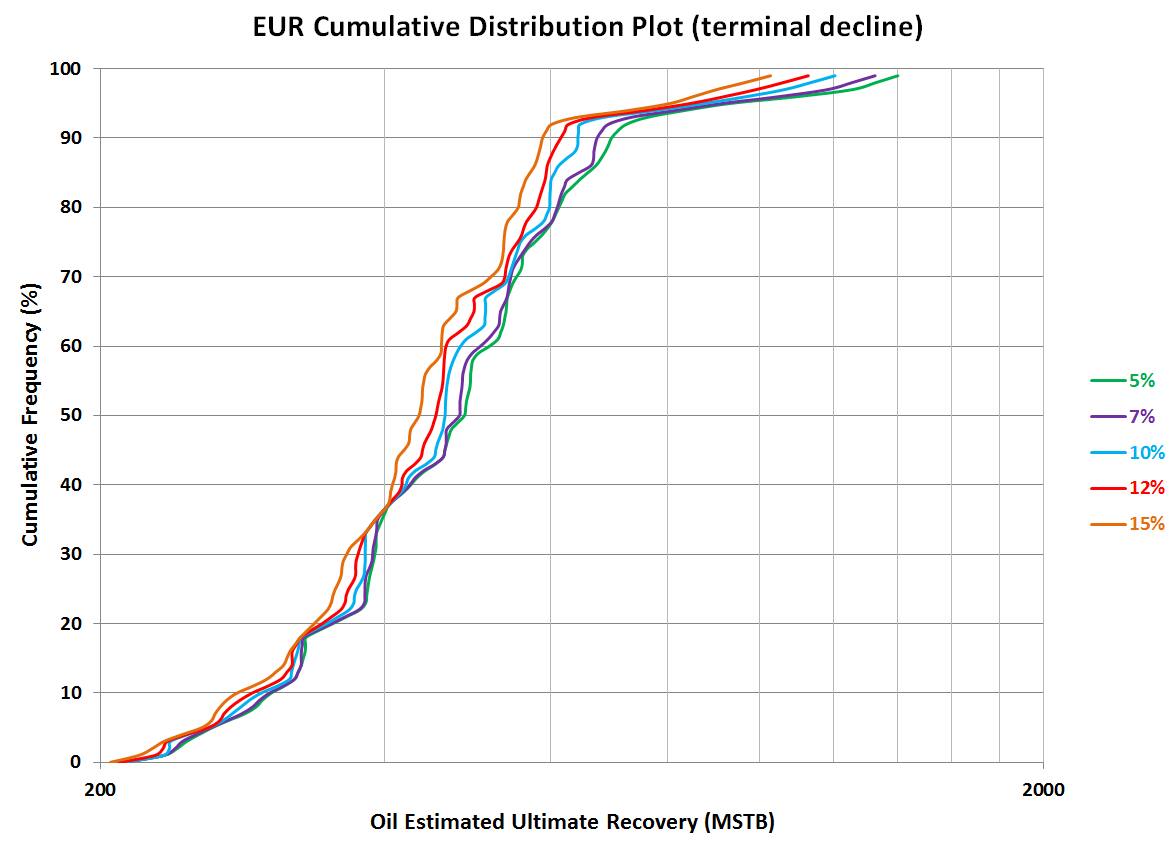
Figure 6: EUR comparison (Sensitivities on terminal decline)
In summary, larger terminal declines and earlier abandonment times do have a significant impact on the predicted recovery of the well, and hence, on the derived economic returns. Many factors can impact the late well life production profile, including operational factors such as artificial lift strategy and flow assurance, as well as degradation of the fractures (e.g. proppant crushing, fracture closure and stress changes), GOR increase (e.g. when the reservoir pressure drops below saturation pressure) and well spacing effects (e.g. fracture interference) which may only be felt later. Without a longer production history, it's difficult to conclusively calculate which scenario is more likely, and from a pure decline perspective, it becomes a probabilistic problem as no single solution can be proven.
However, physics-based models can help. The Harmony Reservoir component within Harmony Enterprise includes analytical and numerical models which include the effect of the reservoir and completion, by capturing the impact of rock, fluid and completions behavior, although more data is required: in our example, we only used monthly production rates, but a reliable reservoir model requires more data, <span/>typically accessible by the well-operator, such as daily production data with associated flowing pressures, as well as rock and fluid properties. These models will be a topic of discussion in a future blog post.
In conclusion, we learned that the assumptions made on the abandonment conditions and terminal decline have significant impact on the estimated recovery of wells in unconventional reservoirs, and attention must be paid to further explore these uncertainties.
Learn more about Harmony Forecast.
Adriana Hernandez is a Senior Technical Advisor in
Engineering at IHS Markit.
Posted 10 May 2019
--------------------------------------
Reference:
* Fracking's Secret Problem—Oil Wells Aren't Producing as Much as Forecast
This article was published by S&P Global Commodity Insights and not by S&P Global Ratings, which is a separately managed division of S&P Global.
{"items" : [
{"name":"share","enabled":true,"desc":"<strong>Share</strong>","mobdesc":"Share","options":[ {"name":"facebook","url":"https://www.facebook.com/sharer.php?u=http%3a%2f%2fssl.ihsmarkit.com%2fcommodityinsights%2fen%2fci%2fresearch-analysis%2fimpact-of-decline-parameters-on-your-expected-ultimate-recover.html","enabled":true},{"name":"twitter","url":"https://twitter.com/intent/tweet?url=http%3a%2f%2fssl.ihsmarkit.com%2fcommodityinsights%2fen%2fci%2fresearch-analysis%2fimpact-of-decline-parameters-on-your-expected-ultimate-recover.html&text=Impact+of+decline+parameters+on+your+expected+ultimate+recoverable+reserves+%7c+S%26P+Global+","enabled":true},{"name":"linkedin","url":"https://www.linkedin.com/sharing/share-offsite/?url=http%3a%2f%2fssl.ihsmarkit.com%2fcommodityinsights%2fen%2fci%2fresearch-analysis%2fimpact-of-decline-parameters-on-your-expected-ultimate-recover.html","enabled":true},{"name":"email","url":"?subject=Impact of decline parameters on your expected ultimate recoverable reserves | S&P Global &body=http%3a%2f%2fssl.ihsmarkit.com%2fcommodityinsights%2fen%2fci%2fresearch-analysis%2fimpact-of-decline-parameters-on-your-expected-ultimate-recover.html","enabled":true},{"name":"whatsapp","url":"https://api.whatsapp.com/send?text=Impact+of+decline+parameters+on+your+expected+ultimate+recoverable+reserves+%7c+S%26P+Global+ http%3a%2f%2fssl.ihsmarkit.com%2fcommodityinsights%2fen%2fci%2fresearch-analysis%2fimpact-of-decline-parameters-on-your-expected-ultimate-recover.html","enabled":true}]}, {"name":"rtt","enabled":true,"mobdesc":"Top"}
]}

