Customer Logins
Obtain the data you need to make the most informed decisions by accessing our extensive portfolio of information, analytics, and expertise. Sign in to the product or service center of your choice.
Customer Logins
BLOG
Feb 06, 2014
IHS Energy 50: 2014 results show international oil companies outperforming national oil companies
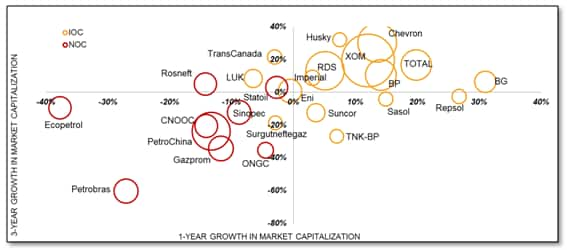
On the whole, IOCs in the index gained 9% in value while NOCs in the index lost 15% in value during 2013.
The IHS Energy 50 (formerly the PFC Energy 50) is the definitive ranking of the world's leading publicly traded energy companies by market capitalization. The listing includes companies from nine sectors: International Oil Companies; National Oil Companies; Exploration & Production; Midstream/Infrastructure; Refining & Marketing; Gas & Power Utilities; Oilfield & Drilling Services; Equipment, Engineering & Construction; and Alternative Energy.
The 2014 IHS Energy 50 report was published Monday, January 27. In the latest of a series of blog posts, we shift from North American players to International Oil Company (IOC) and National Oil Company (NOC) performance in 2013.
Please note that the Energy 50 reports on the previous year's figures so these were the numbers reported at the end of 2013.
Clear Value Attraction to IOCs over NOCs
Unlike previous years, where IOCs and NOCs saw mixed performances, IOCs clearly outperformed NOCs in 2013. While the combined value of IOCs rose by an average 9% in 2013, the value of the top NOCs fell by 15% year over year. This speaks to some extent about investor expectations, with uncertainty about who took priority amongst NOC shareholders.
All of the IOC majors - ExxonMobil, Chevron, Royal Dutch Shell, BP and TOTAL - recorded positive one- and three-year growth in market capitalization, with all but Royal Dutch Shell reporting double-digit growth in 2013. Though the IOCs have similar business models seeking large-scale, repeatable growth, some nuances of strategy appear to have been reflected in how investors value companies. Royal Dutch Shell's focus on large-scale, high CAPEX projects is a classic example of a strategy laid out to differentiate it from its peers - and likely the reason it did not see as high a rise in value as its peers. While the company's long-life projects promise steady cash flows far into the future, high capital outlay requirements in the near term appear hard to justify. The rosy picture of high market valuations in 2013 may be dimming - with Q4 2013 earnings warnings coming from Shell, ExxonMobil and Chevron.
The good news of rising IOC value is tempered for some companies when taken in context. Of note are the two one-year star performers, BG and Repsol, which recorded 31% and 27% growth in one-year market cap, respectively. The gains returned the pair to their 2011 value after each suffered heavy declines in market capitalization in 2012; BG saw a decline in market cap of 23% from 2011 to 2012 while Repsol saw a decline of 31%. BG's market cap of $73.3 billion at the end of 2013 was ~1% higher than its value at the end of 2011 with Repsol, recording a value of $32.1 billion, sitting 12% lower than its value at the end of 2011.
All of the NOCs recorded negative one-year performance, with all but three falling by more than 10% in value. Statoil saw the best one-year performance of the group, with a 3% drop in market capitalization at the end of 2013 compared to the end of 2012. Unlike the top IOCs, which have largely seen slow, but steady growth since the 2009 financial crisis, the NOCs saw a wave of investment in 2009 that shot value skyward, but have since returned to pre-crisis levels.
Posted 6 February 2014
This article was published by S&P Global Commodity Insights and not by S&P Global Ratings, which is a separately managed division of S&P Global.
{"items" : [
{"name":"share","enabled":true,"desc":"<strong>Share</strong>","mobdesc":"Share","options":[ {"name":"facebook","url":"https://www.facebook.com/sharer.php?u=http%3a%2f%2fssl.ihsmarkit.com%2fcommodityinsights%2fen%2fci%2fresearch-analysis%2fihs-energy-50-2014-results-show-international-oil-companies-outperforming-national-oil-companies.html","enabled":true},{"name":"twitter","url":"https://twitter.com/intent/tweet?url=http%3a%2f%2fssl.ihsmarkit.com%2fcommodityinsights%2fen%2fci%2fresearch-analysis%2fihs-energy-50-2014-results-show-international-oil-companies-outperforming-national-oil-companies.html&text=S%26P+Global+Energy+50%3a+2014+results+show+international+oil+companies+outperforming+national+oil+companies","enabled":true},{"name":"linkedin","url":"https://www.linkedin.com/sharing/share-offsite/?url=http%3a%2f%2fssl.ihsmarkit.com%2fcommodityinsights%2fen%2fci%2fresearch-analysis%2fihs-energy-50-2014-results-show-international-oil-companies-outperforming-national-oil-companies.html","enabled":true},{"name":"email","url":"?subject=S&P Global Energy 50: 2014 results show international oil companies outperforming national oil companies&body=http%3a%2f%2fssl.ihsmarkit.com%2fcommodityinsights%2fen%2fci%2fresearch-analysis%2fihs-energy-50-2014-results-show-international-oil-companies-outperforming-national-oil-companies.html","enabled":true},{"name":"whatsapp","url":"https://api.whatsapp.com/send?text=S%26P+Global+Energy+50%3a+2014+results+show+international+oil+companies+outperforming+national+oil+companies http%3a%2f%2fssl.ihsmarkit.com%2fcommodityinsights%2fen%2fci%2fresearch-analysis%2fihs-energy-50-2014-results-show-international-oil-companies-outperforming-national-oil-companies.html","enabled":true}]}, {"name":"rtt","enabled":true,"mobdesc":"Top"}
]}