Customer Logins
Obtain the data you need to make the most informed decisions by accessing our extensive portfolio of information, analytics, and expertise. Sign in to the product or service center of your choice.
Customer Logins
BLOG
Apr 10, 2018
Energy cycle realities: implications for chemical industry investment strategies

Every energy cycle has resulted in certain feedstocks becoming more or less advantageous to petrochemical producers — depending on individual products, locations, and processes. The most recent example of an energy market shift that resulted in high-cost producers becoming competitive and profitable was the sharp collapse in crude oil prices in second-half 2014. As crude oil prices fell from over $100 per barrel of oil (bbl) to less than $40/bbl (Brent), ethylene operations consuming naphtha feedstocks became profitable assets “overnight.”
Earlier, during the 1990s and the first decade of the 2000s, raw materials favored to produce ethylene and propylene cycled between light and heavy feedstocks. These cycles were driven by changing energy markets as well as regional availability and cost. Regional competitiveness has changed dramatically through these cycles, resulting in shifts in focus for new capital investment decisions.
Understanding the implications of energy cycles on competitiveness in the industry is critical to long-term success.Assumptions regarding energy and feedstock price trends for the future influence location and technology decisions for new capital investments. Companies must also consider other factors, including market access for derivative products and vertical integration strategies. If a downstream business relies mainly on ethylene chemistry, then ethane-based ethylene would seem an obvious technology choice. An investment in naphtha-based ethylene capacity would suggest the company has downstream businesses that rely heavily on the full slate of higher-value hydrocarbons.
Knowing whether to pursue investment planning decisions that involve heavy or light feedstocks is a challenging task. How can the planning team assess both current and coming energy cycles and use that insight to inform investment decisions? It all starts with assessing scenarios to better comprehend feedstock competitiveness over time.
Reviewing a history of feedstock competitiveness
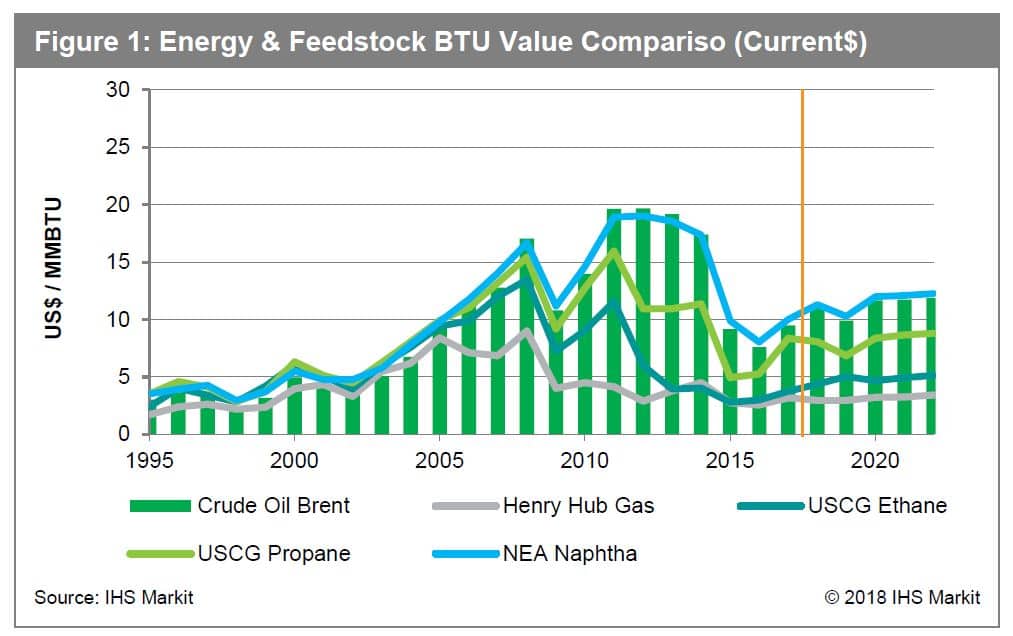
Figure 1 provides a historical perspective on the changes in energy markets over time, as well as the most current forecast from IHS Markit Energy teams. The energy and feedstock products shown are all converted to a BTU basis to provide a relative comparison of value or cost.
From a chemical analysis viewpoint, there are two distinct historical periods:
1990 – 2004: Prices were low and stable compared to today, providing an almost neutral incentive from a pure cost perspective. The selection of heavy versus light was driven mainly by location or availability, capital cost, and downstream business needs.
2005 – 2014: This period represents “energy at the extremes,” during which a significant increase in the price of crude oil raised the cost basis for heavy feedstocks. During the pre-shale renaissance, this period was also defined by elevated, volatile natural gas and natural gas liquid (NGL) prices. Next was a shale oil and gas renaissance period for the US, which brought an abundant supply of crude oil, associated natural gas, and NGL feedstocks to the US market. A significant differential developed between light and heavy feedstocks, and the industry began a period of conversion to lighter feeds.
Responding to the energy cycle of the 2000s, chemical companies have invested in ethane-based feedstock and non-conventional, “on-purpose” technologies to support growth. Since 2010, the North American market has experienced a chemical industry investment renaissance. The surge in energy development resulted in a clear pricing advantage for North American-produced ethane, to the disadvantage of heavy feedstocks. New assets began coming online in 2016 and additional investments in the region are expected to continue well into the 2020s.
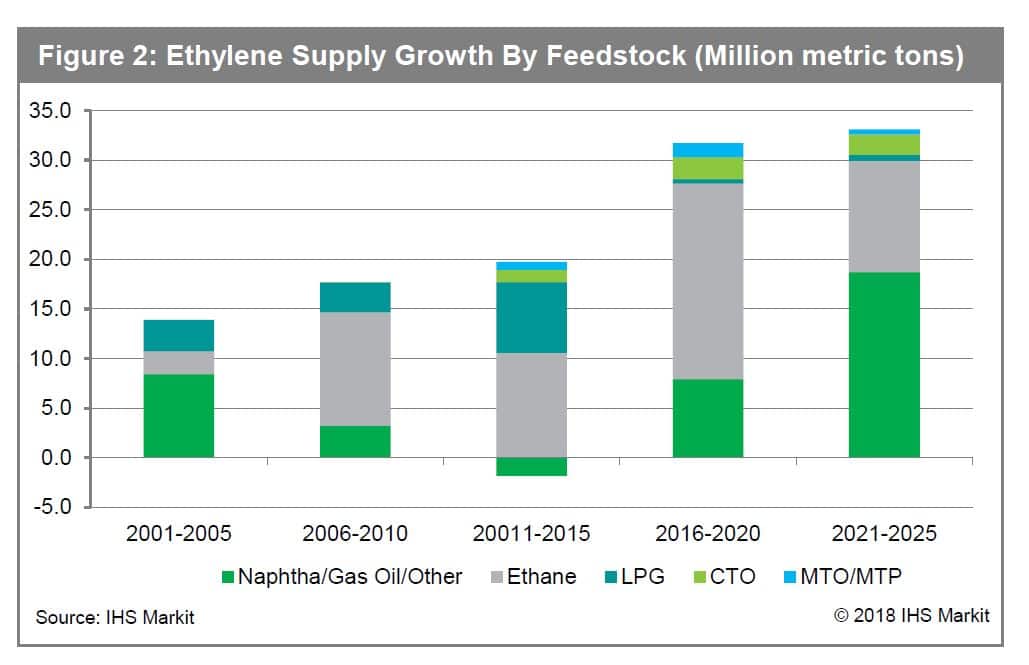
Figure 2 represents the total amount of ethylene supply growth (by feedstock) in five year periods, from 2000 through 2025. The incremental supply of ethylene globally was dominated by ethane and liquefied petroleum gas (LPG) feedstock, with naphtha-based feed decreasing from 2006 to 2015. The use of naphtha as a feedstock begins to increase in the 2016-2020 period. This shift is based on lower (crude oil) prices that make naphtha more competitive. In addition, strong demand growth for ethylene will press all available ethylene production to maximum utilization during this period. The 2021-2025 period shows continued growth in the demand for naphtha as the availability of low-cost ethane begins to slow. Naphtha remains high-cost, although readily available and necessary to meet overall demand growth.
Analyzing the best feedstocks for each business
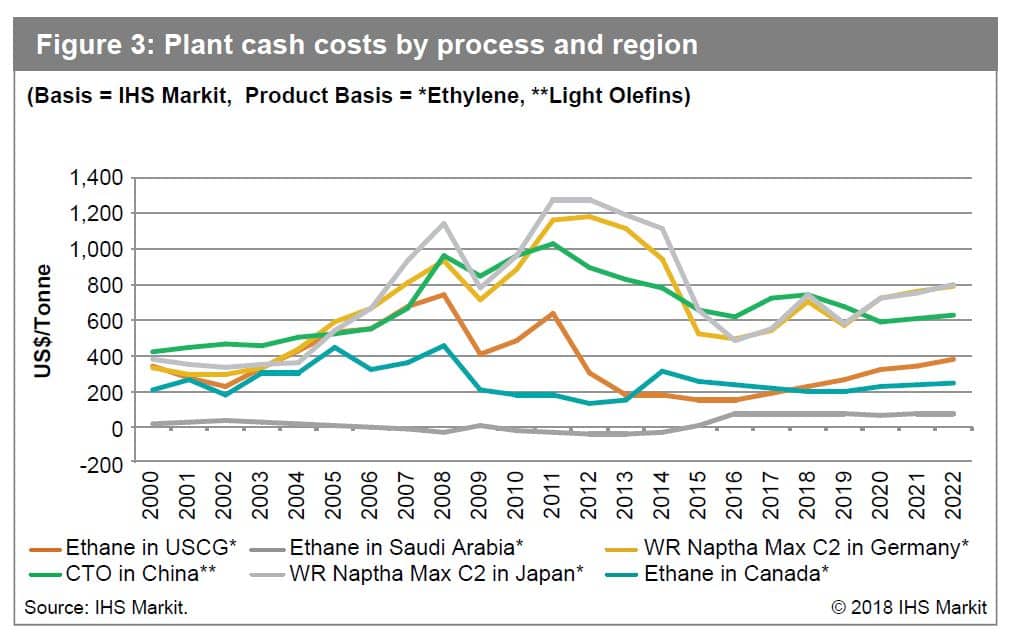
Each company must evaluate its feedstock possibilities based on product mix and integration, energy cycle expectations, investment timeframes, and appetite for risk. Simply stated, heavier feedstocks support a broader mix of products and a higher capital investment while lighter feedstocks tend to narrow the product portfolio but reduce capital cost. Of course, projections and assumptions are always more powerful when decision makers can visualize potential results. Using a new IHS Markit-developed tool called Project Comparison Cost Tracker (PCCT), clients can compare the impact of choosing different feedstocks for specific energy scenarios. The tool projects varying levels of cost competitiveness per feedstock over time. Clients can compare the bottom-line impact of choosing heavy versus light feedstocks and compare them with on-purpose technologies. These comparisons enable insight into cost-competitiveness for each feedstock and assess potential implications for the business over an energy cycle.
Figure 3 shows sample outputs of the tool, comparing plant cash costs for six different technologies, for six locations, over a full energy cycle. Key insights from this analysis show ethane-based feedstocks remaining low-cost while naphtha and coal are disadvantaged. A further comparison to production costs (including depreciation and overhead) can provide insights for predicting market behavior through energy and supply-demand cycles. The cyclicality of energy markets will continue to heavily influence capital investment decisions for the chemicals industry. Getting both location and technology “just right” to meet the needs of a business over the long term is a difficult task. Today, scenario planning seems to be the best option for assessing the opportunities and risks that are associated with a given set of energy and supply-demand assumptions. The use of advanced analytics and tools such as PCCT has become essential to help planning teams frame a picture of the future so that final investment decisions can be made with the best available information.
{"items" : [
{"name":"share","enabled":true,"desc":"<strong>Share</strong>","mobdesc":"Share","options":[ {"name":"facebook","url":"https://www.facebook.com/sharer.php?u=http%3a%2f%2fssl.ihsmarkit.com%2fcommodityinsights%2fen%2fci%2fresearch-analysis%2fenergy-cycle-realities-implications-chemical-investment-strategies.html","enabled":true},{"name":"twitter","url":"https://twitter.com/intent/tweet?url=http%3a%2f%2fssl.ihsmarkit.com%2fcommodityinsights%2fen%2fci%2fresearch-analysis%2fenergy-cycle-realities-implications-chemical-investment-strategies.html&text=Energy+cycle+realities%3a+implications+for+chemical+industry+investment+strategies","enabled":true},{"name":"linkedin","url":"https://www.linkedin.com/sharing/share-offsite/?url=http%3a%2f%2fssl.ihsmarkit.com%2fcommodityinsights%2fen%2fci%2fresearch-analysis%2fenergy-cycle-realities-implications-chemical-investment-strategies.html","enabled":true},{"name":"email","url":"?subject=Energy cycle realities: implications for chemical industry investment strategies&body=http%3a%2f%2fssl.ihsmarkit.com%2fcommodityinsights%2fen%2fci%2fresearch-analysis%2fenergy-cycle-realities-implications-chemical-investment-strategies.html","enabled":true},{"name":"whatsapp","url":"https://api.whatsapp.com/send?text=Energy+cycle+realities%3a+implications+for+chemical+industry+investment+strategies http%3a%2f%2fssl.ihsmarkit.com%2fcommodityinsights%2fen%2fci%2fresearch-analysis%2fenergy-cycle-realities-implications-chemical-investment-strategies.html","enabled":true}]}, {"name":"rtt","enabled":true,"mobdesc":"Top"}
]}