Customer Logins
Obtain the data you need to make the most informed decisions by accessing our extensive portfolio of information, analytics, and expertise. Sign in to the product or service center of your choice.
Customer Logins
BLOG
Aug 21, 2017
Changes in shale well design: Reaching the limits?

The industry adapted remarkably fast to the 2014 collapse in crude oil prices. Its survival was rooted in four factors: collapsing service sector prices, retrenchment to the core, improved well design, and learning. In the third quarter of 2016, the Lower 48 started showing signs of a robust recovery, and a year later, activity has doubled and growth has returned.
How are these elements behaving? Is the cycle unwinding? This blog post focuses on well design in the five major unconventional plays.
Can we expect further improvements in lateral length and proppant intensity leading to further productivity gains?
In reality, each play tells a different story in terms of maturity level, operator landscape and leasehold pattern. For the system as a whole, we believe that running room remains and will continue to raise well productivity by creating longer, more intense wells. However, over time, we believe those gains will peter out. Using a baseball analogy, we would submit that
- Lateral length extension is likely in the 7th inning, primarily because leasehold configuration is constraining many operators in the Bakken and Permian.
- Proppant intensity strikes as being in the 4th inning. In the Eagle Ford and the Bakken, data suggest that changes in completion design will likely be driven by a rising adoption rate, while the Permian (particularly the Delaware Basin) should see the compounding benefit of both leading edge and broader adoption rate gains.
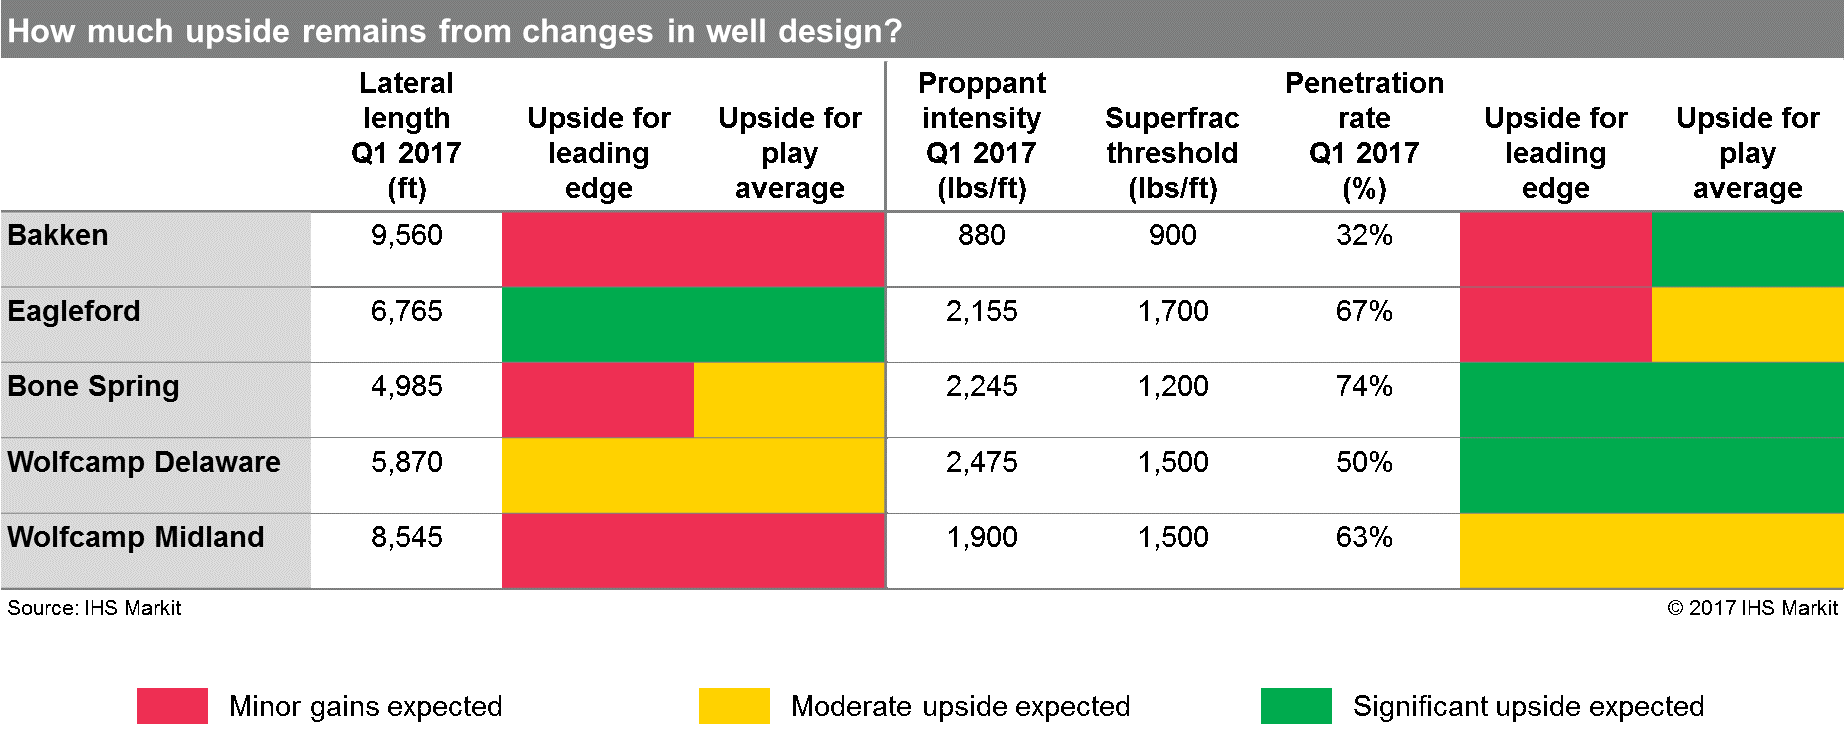
Figure 1: Upside from changes in well design
The color-coding in the table above indicates if we expect a minor, moderate or significant upside to either the leading edge or the play average. The first column indicates if an operator or several operators have set an apparent best practice in the play and the second column indicates if the rest of the operators are catching up with this best practice.
The superfrac threshold is a subjective one. It is set based on the P10 (10% of the wells exceed the P10 estimate) of each play observed before operators started serious experimentation in 2015. The penetration rate indicates the share of the superfracs in each play's total well count. It gives an indication of how many operators are using high proppant loads.
Lateral length
Trends in lateral length differ from one play to the next. In the Bakken, there is a cluster effect where most operators have been drilling laterals in the 9,000-10,000 foot range. This combined with the fact that the play's average and P10 seem to have plateaued, lead us to expect minor upside for the leading edge as well as the play average. The Eagle Ford does not display this cluster effect and after a few years of flattening, the play's average started moving up towards the middle of 2016 as several operators are experimenting with longer laterals. Therefore, we believe that the leading edge has not been found and that the play average will continue to increase.
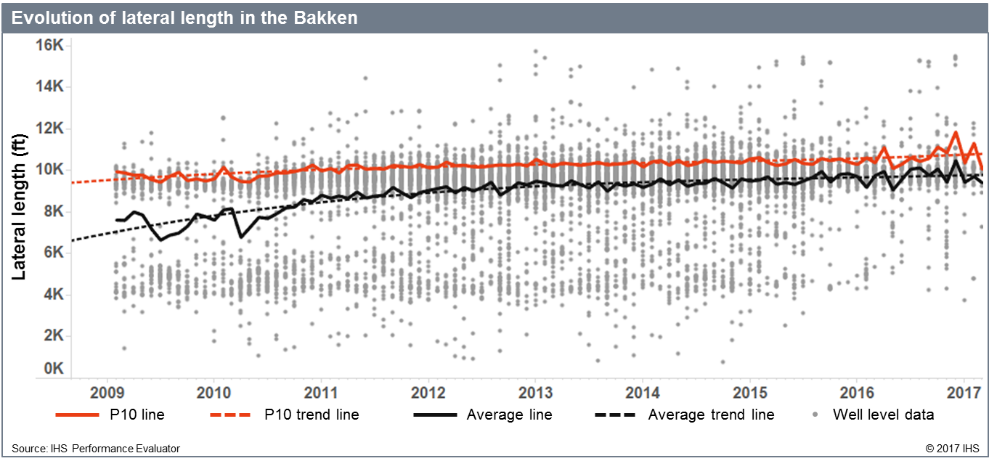
Figure 2: Lateral length in the Bakken
In the Permian, we expect minor to moderate gains mostly as we take into account the leasehold pattern of the play. The Permian has been drilled for over 80 years. Acreage holdings are small because many leases have been held by production for a long time. Therefore, it can be difficult to drill laterals longer than 5,000 feet. However, we remain optimistic and believe some operators might be able to find a way around the leasehold pattern issue if they buy adjacent acreage or it they partner with their neighbors. This is why we expect moderate upside to the play average and not just minor upside. The Wolfcamp Midland has the longest laterals of the Permian plays. The optimum has been set by operators such as Pioneer at about 9,000 to 10,000-foot laterals. Pioneer has been testing longer laterals since 2013, but other operators have been catching up with this best practice and the gap is now closed, hence our expectation of minor upside.
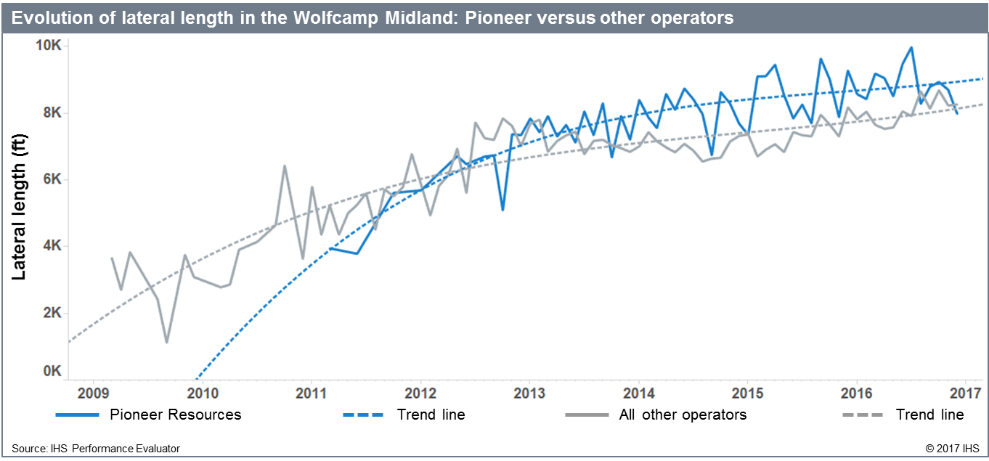
Figure 3: Lateral length in the Wolfcamp Midland: Pioneer versus other operators
Proppant Intensity
In the Bakken an in the Eagle Ford, EOG has set the leading edge and its average proppant intensity has now flattened in both plays. However, while the rest of operators have been fast at catching up with EOG in the Eagle Ford, they have been relatively slow in the Bakken. This is why we expect minor upside to the leading edge in both plays but significant and moderate upside to the play average in the Bakken and Eagle Ford, respectively.
We would note that all over the US, the rising costs of proppant have lowered the optimal completion intensity since operators are fundamentally seeking to maximize economics, not physical volumes. For the most part, these move together, but high costs in effect lower the benefit of incremental proppant and eventually the threshold at which marginal gains diminish to zero.
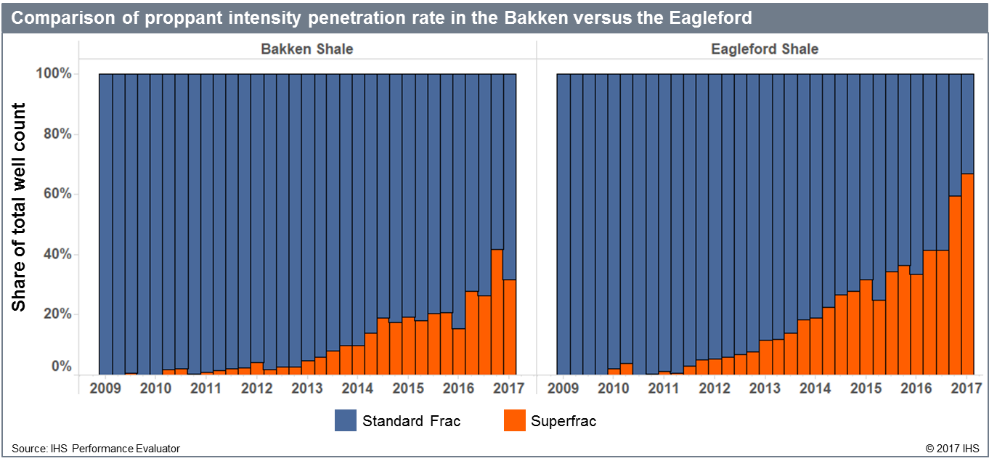
Figure 4: Comparison of proppant intensity penetration rate in the Bakken versus the Eagleford
In the Permian, and most particularly in the Bone Spring and Wolfcamp Delaware, the industry is testing aggressively, which suggests operators are still looking for the apparent optimum. Consequently, we expect significant upside to the leading edge and the play average of both plays. However, the story is different in the Wolfcamp Midland, where the P10 has been flattening. This leads us to foresee moderate upside to the leading edge. As the penetration rate is high in this play, we expect only moderate upside to the play average.
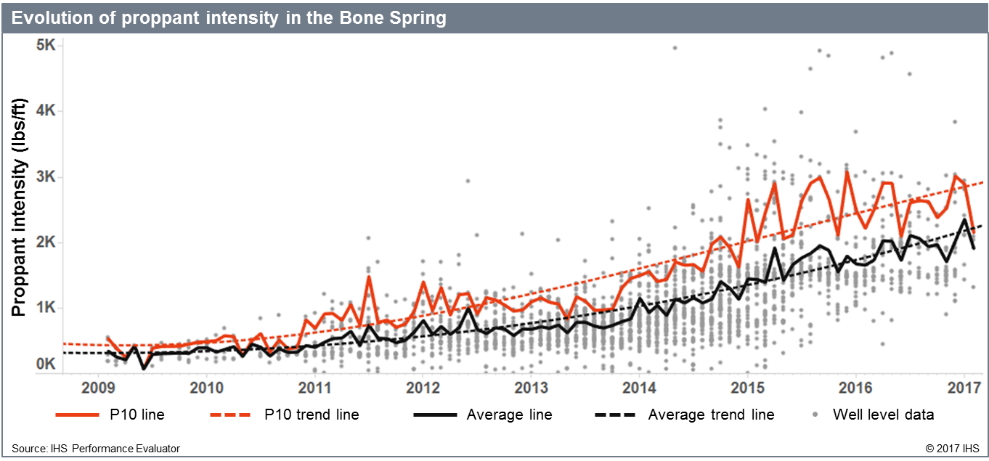
Figure 5: Evolution of proppant intensity in the Bone Spring
Are you working in the Permian? See our solutions for the Permian Basin.
Emilie Gubian is Principal Economist, Performance Evaluator at IHS Markit.
Posted 21 August 2017
This article was published by S&P Global Commodity Insights and not by S&P Global Ratings, which is a separately managed division of S&P Global.
{"items" : [
{"name":"share","enabled":true,"desc":"<strong>Share</strong>","mobdesc":"Share","options":[ {"name":"facebook","url":"https://www.facebook.com/sharer.php?u=http%3a%2f%2fssl.ihsmarkit.com%2fcommodityinsights%2fen%2fci%2fresearch-analysis%2fchanges-in-shale-well-design-reaching-the-limits.html","enabled":true},{"name":"twitter","url":"https://twitter.com/intent/tweet?url=http%3a%2f%2fssl.ihsmarkit.com%2fcommodityinsights%2fen%2fci%2fresearch-analysis%2fchanges-in-shale-well-design-reaching-the-limits.html&text=Changes+in+shale+well+design%3a+Reaching+the+limits%3f","enabled":true},{"name":"linkedin","url":"https://www.linkedin.com/sharing/share-offsite/?url=http%3a%2f%2fssl.ihsmarkit.com%2fcommodityinsights%2fen%2fci%2fresearch-analysis%2fchanges-in-shale-well-design-reaching-the-limits.html","enabled":true},{"name":"email","url":"?subject=Changes in shale well design: Reaching the limits?&body=http%3a%2f%2fssl.ihsmarkit.com%2fcommodityinsights%2fen%2fci%2fresearch-analysis%2fchanges-in-shale-well-design-reaching-the-limits.html","enabled":true},{"name":"whatsapp","url":"https://api.whatsapp.com/send?text=Changes+in+shale+well+design%3a+Reaching+the+limits%3f http%3a%2f%2fssl.ihsmarkit.com%2fcommodityinsights%2fen%2fci%2fresearch-analysis%2fchanges-in-shale-well-design-reaching-the-limits.html","enabled":true}]}, {"name":"rtt","enabled":true,"mobdesc":"Top"}
]}