Customer Logins
Obtain the data you need to make the most informed decisions by accessing our extensive portfolio of information, analytics, and expertise. Sign in to the product or service center of your choice.
Customer Logins
BLOG
Jul 09, 2019
Building up the pressure – Fracture data

Geopressure data is not just limited to formation pressure data.
Fracture pressures from Leak-off and Formation Integrity Tests, and from lost circulation events are also key sources which facilitate the identification of a suitable drilling mud weight, or to help establish regional fracture gradients. But how can we be sure this data is reliable?
Leak-off test analysis
The Composite Well Log for this example well identifies an FIT of 15.0ppg EMW at 4344'; the 13⅝" casing shoe. This suggests that a 15.0ppg mud would be sufficient to drill the next hole section without fracturing the well.
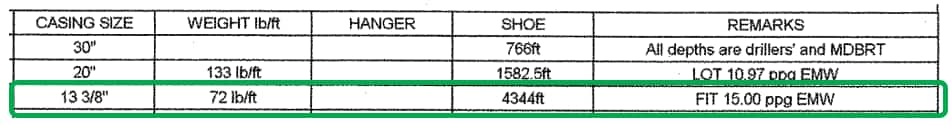
Figure 1: Composite Well Log
The operator summary from the Leak-off chart located in the end of well report supports this (albeit with a fractional smaller value).
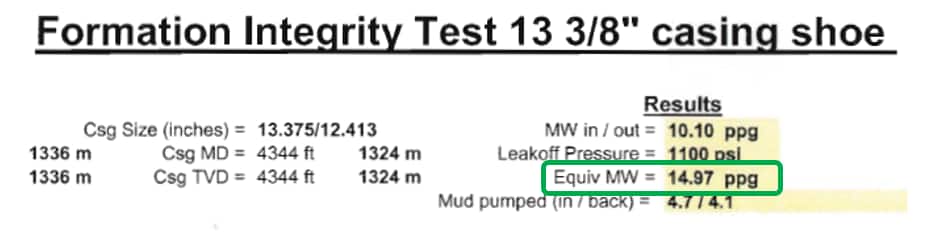
Figure 2: Formation Integrity Test
We should however, be concerned by mud weight volumes. 4.7 barrels of mud were pumped during the test, but only 4.1 barrels returned. The loss of 0.6 barrels suggests the well may have fractured and therefore 'leaked-off' instead.
Let's look at the pressure build-up throughout the test in more detail. In a standard FIT we expect to see a linear increase in pressure with time. If the build-up curve deviates from this, it infers a leak-off; the point at which the well has fractured and begins to lose mud.
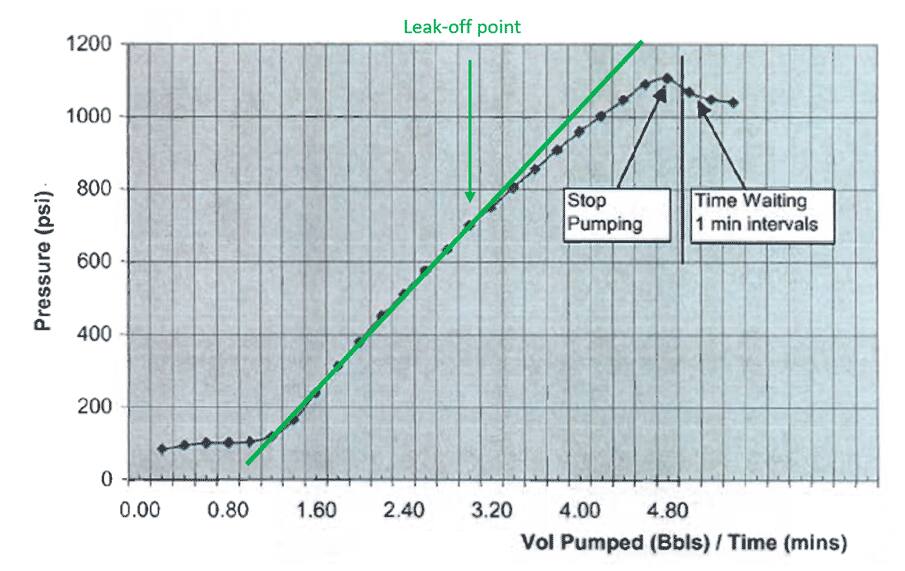
Figure 3: Leak-off Point
The build-up first deviates at 700psi. This implies that the well has started to lose mud. If we re-calculate the equivalent mud weight using this pressure rather than the 1100psi maximum pump pressure, we obtain a new value of 13.2ppg EMW and reclassify to a leak-off test. That 15.0ppg mud isn't looking quite so safe now…
These are not isolated incidents.
The next example shows how an FIT to 1.6sg EMW becomes a leak-off test to 1.56sg EMW (29 bar pump pressure) on closer inspection. There is a clear deviation in the build-up profile and there is a notable volume of mud lost:
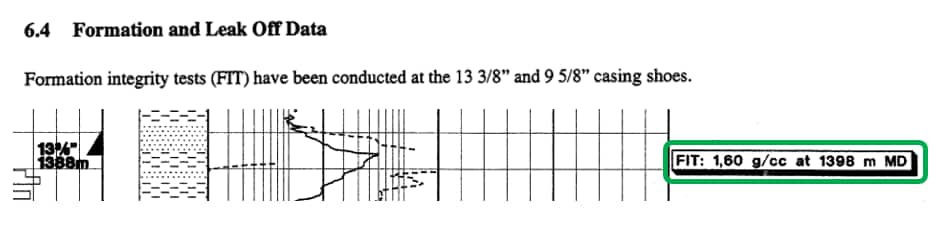
Figure 4: Formation and Leak Off Data
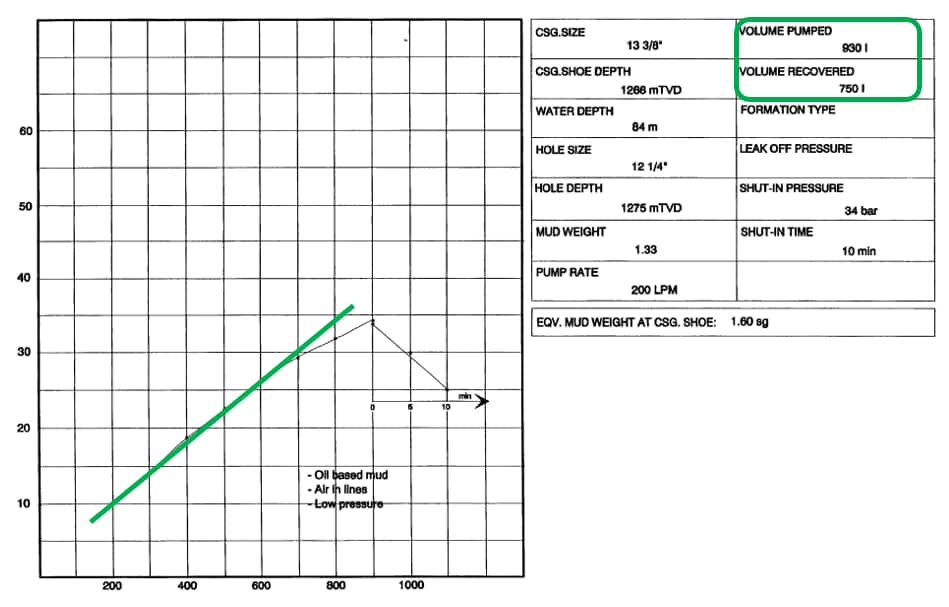 Figure 5: Formation and Leak Off
Data
Figure 5: Formation and Leak Off
Data
These examples illustrate the importance of undertaking detailed
analysis of the data and not relying on operator/contractor test
classification. The IHS
Markit geopressure database incorporates all these quality
steps and more, ensuring that the most accurate data is available
to you.
Robert Labrum is a manager for EMEA Subsurface Content at IHS Markit.
Posted 9 July 2019
This article was published by S&P Global Commodity Insights and not by S&P Global Ratings, which is a separately managed division of S&P Global.
{"items" : [
{"name":"share","enabled":true,"desc":"<strong>Share</strong>","mobdesc":"Share","options":[ {"name":"facebook","url":"https://www.facebook.com/sharer.php?u=http%3a%2f%2fssl.ihsmarkit.com%2fcommodityinsights%2fen%2fci%2fresearch-analysis%2fbuilding-up-the-pressure-fracture-data.html","enabled":true},{"name":"twitter","url":"https://twitter.com/intent/tweet?url=http%3a%2f%2fssl.ihsmarkit.com%2fcommodityinsights%2fen%2fci%2fresearch-analysis%2fbuilding-up-the-pressure-fracture-data.html&text=Building+up+the+pressure+%e2%80%93+Fracture+data+%7c+S%26P+Global+","enabled":true},{"name":"linkedin","url":"https://www.linkedin.com/sharing/share-offsite/?url=http%3a%2f%2fssl.ihsmarkit.com%2fcommodityinsights%2fen%2fci%2fresearch-analysis%2fbuilding-up-the-pressure-fracture-data.html","enabled":true},{"name":"email","url":"?subject=Building up the pressure – Fracture data | S&P Global &body=http%3a%2f%2fssl.ihsmarkit.com%2fcommodityinsights%2fen%2fci%2fresearch-analysis%2fbuilding-up-the-pressure-fracture-data.html","enabled":true},{"name":"whatsapp","url":"https://api.whatsapp.com/send?text=Building+up+the+pressure+%e2%80%93+Fracture+data+%7c+S%26P+Global+ http%3a%2f%2fssl.ihsmarkit.com%2fcommodityinsights%2fen%2fci%2fresearch-analysis%2fbuilding-up-the-pressure-fracture-data.html","enabled":true}]}, {"name":"rtt","enabled":true,"mobdesc":"Top"}
]}