Customer Logins
Obtain the data you need to make the most informed decisions by accessing our extensive portfolio of information, analytics, and expertise. Sign in to the product or service center of your choice.
Customer Logins
BLOG
Jul 04, 2019
Building up the pressure – Alternative sources of formation pressure data

Where can we obtain formation pressure data from in the absence of wireline or while-drilling formation testers?
Detailed Drill Stem Test (DST) analysis - Acquiring
Formation Pressures from DSTs
Access to detailed pressure vs time data for pressure gauges enables us to calculate a stable formation pressure.
In the following example, DST 1 was run across the interval 8660' to 8766'. The formation pressure from this DST can be extrapolated from the pressure data acquired from the well site test report.
The first step is to identify the pressure gauge to be used to calculate the formation pressure. Several gauges monitor the pressure, with one gauge being singled out as the 'primary gauge'. The following table has been extracted from the well site test report and contains information on the four gauges monitoring downhole pressures on the DST tool.

Figure 1: DST tool
In this instance, gauge 35067 was reported as the primary gauge. All pressures collated from this gauge are valid at the sensing depth of 8491.71' MD.
The pressure recorded for the initial build-up period, 4070.81 psia is the closest approximation we have at present to the formation pressure, unless we do some further analysis.
The following graph details the variations in pressure throughout the duration of the test and shows how the pressure begins to build-up towards reservoir pressure during the build-up phase once the well has been shut-in.
A detailed break-down of the pressures and temperatures is provided over time for the primary gauge. We note the duration of the initial flow period and the build-up period alongside the final pressure values from the end of the build-up.

Figure 2: Graphic summary of pressure variations throughout DST
1
The flow period began at 17.50 where it was first opened on an 18/64" choke:
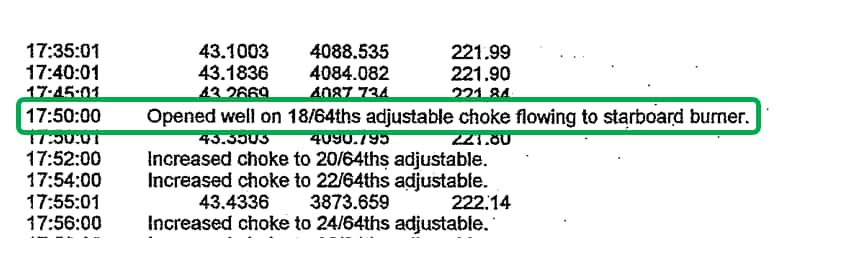
Figure 3: Flow period
The well was flowed until 20.03 on the same day when it was closed in at the choke manifold:
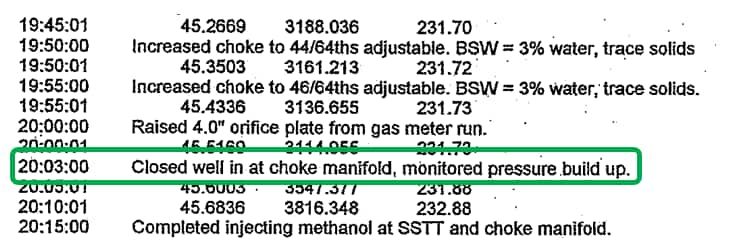
Figure 4: Flow period
The total time the well flowed for was 133 minutes (17.50 - 20.03).
The well was closed in until 00.05 the following day where the pressure built to 4070.809 psia:

Figure 5: Flow period - pressurebuilt
The pressures are still building, so to obtain a stable pressure we can extrapolate using a Horner plot.
The intercept from the line equation gives us the corrected pressure (at gauge depth):

Figure 6: Extrapolated pressure
Using this workflow to capture DST data compliments that from the Wireline Formation Test (WFT) data shown previously ensuring a complete and accurate profile of the formation pressures within the well are captured. The IHS Markit Formation pressure database builds upon these principles to provide the most accurate and comprehensive data set possible.
Robert Labrum is a manager for EMEA Subsurface Content
at IHS Markit.
Posted 4 July 2019
This article was published by S&P Global Commodity Insights and not by S&P Global Ratings, which is a separately managed division of S&P Global.
{"items" : [
{"name":"share","enabled":true,"desc":"<strong>Share</strong>","mobdesc":"Share","options":[ {"name":"facebook","url":"https://www.facebook.com/sharer.php?u=http%3a%2f%2fssl.ihsmarkit.com%2fcommodityinsights%2fen%2fci%2fresearch-analysis%2fbuilding-up-the-pressure-alternative-sources-of-formation.html","enabled":true},{"name":"twitter","url":"https://twitter.com/intent/tweet?url=http%3a%2f%2fssl.ihsmarkit.com%2fcommodityinsights%2fen%2fci%2fresearch-analysis%2fbuilding-up-the-pressure-alternative-sources-of-formation.html&text=Building+up+the+pressure+%e2%80%93+Alternative+sources+of+formation+pressure+data+%7c+S%26P+Global+","enabled":true},{"name":"linkedin","url":"https://www.linkedin.com/sharing/share-offsite/?url=http%3a%2f%2fssl.ihsmarkit.com%2fcommodityinsights%2fen%2fci%2fresearch-analysis%2fbuilding-up-the-pressure-alternative-sources-of-formation.html","enabled":true},{"name":"email","url":"?subject=Building up the pressure – Alternative sources of formation pressure data | S&P Global &body=http%3a%2f%2fssl.ihsmarkit.com%2fcommodityinsights%2fen%2fci%2fresearch-analysis%2fbuilding-up-the-pressure-alternative-sources-of-formation.html","enabled":true},{"name":"whatsapp","url":"https://api.whatsapp.com/send?text=Building+up+the+pressure+%e2%80%93+Alternative+sources+of+formation+pressure+data+%7c+S%26P+Global+ http%3a%2f%2fssl.ihsmarkit.com%2fcommodityinsights%2fen%2fci%2fresearch-analysis%2fbuilding-up-the-pressure-alternative-sources-of-formation.html","enabled":true}]}, {"name":"rtt","enabled":true,"mobdesc":"Top"}
]}