Customer Logins
Obtain the data you need to make the most informed decisions by accessing our extensive portfolio of information, analytics, and expertise. Sign in to the product or service center of your choice.
Customer Logins
BLOG
Apr 28, 2020
Basic Chemicals - The Curve is Already Flattened!

We are living in extraordinary and challenging times. Within basic petrochemicals, these extraordinary times have led to previously 4th quartile naphtha cracker complexes becoming 1st quartile in their own domestic markets.
The global basic chemicals industry has always been cyclical. From 2013 to 2018 it experienced an extended up-cycle with above-reinvestment-level profitability. In 2019, economic headwinds slowed global economic growth, especially in China which impacted the demand for basic chemicals. Other trends such as oil volatility; currency fluctuations; protectionist trade tariffs; reduction in the use of single-use plastics; geopolitical uncertainties such as US-China trade; Brexit; and political turmoil in Europe, the Middle East, South America, and the US all created uncertainties that caused businesses and consumers to become more conservative with their investments and spending. This was all as new capacity start-ups across basic chemicals value chains impacted the market. In the most extreme case, the huge capacity expansions of paraxylene in Asia overwhelmed demand growth despite strong market growth over many years. This resulting oversupply had already decreased industry operating rates and profitability with several producers announced declining financial performance.
Just 6 months later, all of the above has been overshadowed by the Covid-19 pandemic; governments trying to flatten the curve of infection and an oil market-share battle between Saudi Arabia and Russia just as demand collapsed. In April, the benchmark WTI dropped to just $13/bbl. In such an environment it is critical that producers understand their own competitive cost positions relative to their competitors. IHS Markit Chemicals develops cost and margin curves for over 40 petrochemical products. Within each product, every plant is modelled individually considering its nameplate capacity, technology, country-specific feedstock and unit utility costs, country-specific by-product value, country-specific labor costs and shift patterns, maintenance, and other fixed costs. We combine this data with our World Analysis country-by-country capacity, supply and demand balances, and operating rates to show production cost curves, rather than just capacity curves. Production cost curves offer a more realistic view of how the industry operates. The resulting cash-cost-at-plant-gate for all plants can be modified so it can be shown on an integrated or non-integrated basis. It can also include delivery costs, depreciation, corporate overhead, and even an ROI for this year and for 10 years into the future. With the IHS Markit product price forecasts, these cost curves can be turned into margin curves to forecast EBITDA per producer for the next decade. Oil or product price forecast scenarios can be performed, and hypothetical new plants can be put on the curve.
Naphtha and LPG costs drop in proportion with oil
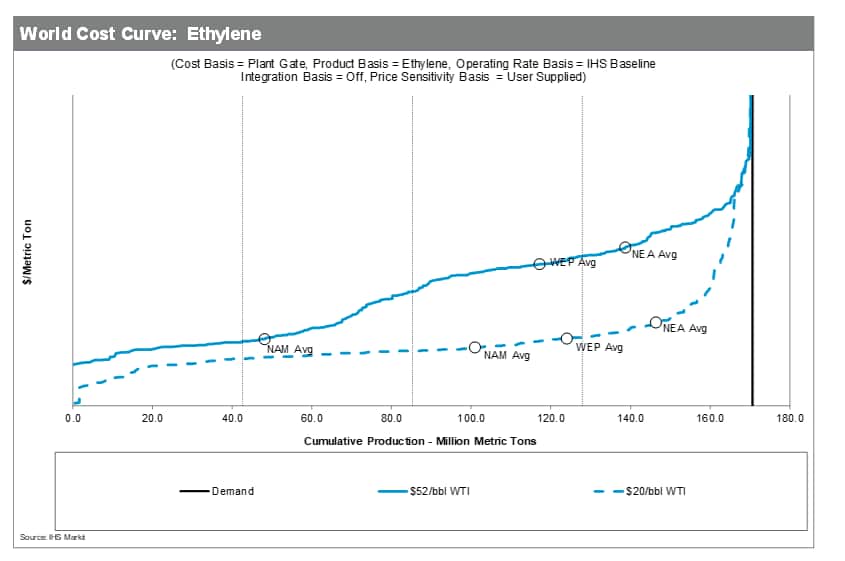
An example of the ethylene plant gate cost curve for 2020 is shown in Figure 1. The full line is at the 2020 annual average WTI oil price forecasted in January ($52/bbl). It is characterized by a plateau of higher-cost producers in the third and fourth quartiles. The producers are mainly naphtha crackers primarily based in Europe and Asia, as shown by the weighted averages. In the first and second quartile are the advantaged NGL crackers in the US and Middle East. There is, of course, a wide range of capacities and technologies that contribute to the weighted averages. Hence it is essential to model each plant individually. The dotted line shows the curve if the WTI oil price averages $20/bbl in 2020. As expected, the curve is much flatter as naphtha and LPG costs drop in proportion with oil. Whilst Europe and Asia crackers are expected to remain 4th quartile, US crackers become much less competitive due to the expected ethane supply squeeze and resulting price rise as oil, and associated NGLs, production is cut back.
Figure 1: World Cost Curve for Ethylene (Plant Gate)
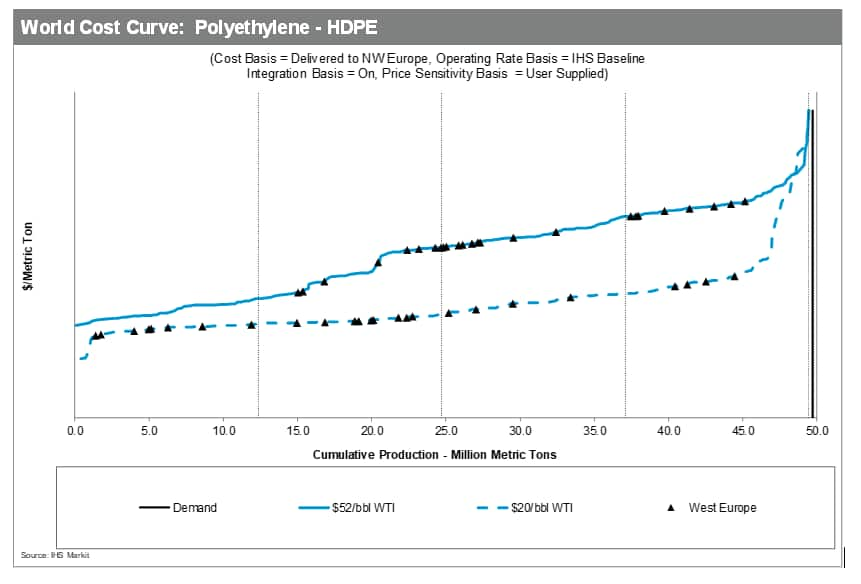
However, this view can be misleading to the overall competitiveness of olefin derivatives complexes. Of course, very little ethylene is sold as monomer; rather as derivative be it polyethylene, ethylene glycol, polystyrene, etc. and preferably in domestic markets that yield a better netback. An example of the HDPE delivered West Europe cost curve for 2020 is shown in Figure 2. The full line is at the 2020 annual average WTI oil price forecasted in January ($52/bbl) and majority of West European producers are still 3rd and 4th quartile. However, the dotted line shows the curve if the WTI oil price averages $20/bbl in 2020. In this scenario, some of these polyolefin complexes move to 1st quartile and over half are now in the upper 2 quartiles. Most of these polyethylene plants consume ethylene from naphtha feedstock steam crackers that, in the past have always been 3rd or 4th quartile.
Figure 2: World Cost Curve for Polyethylene - HDPE (Delivered West Europe)
How do previously 4th quartile complexes become 1st quartile? Apart from the reduction in naphtha and LPG feedstock costs for the domestic producers, the cost of freight and duties becomes a much larger proportion of total delivered cost at this low oil price for exporters to that region. If the above is switched to delivered to China, a similar picture emerges for Chinese polyethylene producers consuming ethylene from naphtha feedstock steam crackers that, in the past have always been 3rd or 4th quartile.
Impact on producers
What does all of this mean to producers? Even before the decrease in oil prices, higher cost producers were struggling to make margins as the overbuild in certain chemical chains such as polyolefins and MEG and perhaps were likely to mothball or shutdown permanently. At the time of writing IHS Markit forecasts that Brent oil prices will remain under $40/bbl for the duration of 2020. Hence this is the opportunity for previously higher cost producers to maintain or even gain market share in their domestic markets. Given the longer-term trend for oil to move upwards only gradually, this provides time for previously higher cost producers to assess their options. For example, a company might look to switch to more premium polymer grades; speed up initiatives to decrease feedstock or utility consumption; enhance process control to increase existing production tons; debottleneck to make a step change in production tons to decrease fixed costs per ton; delay turnarounds if possible or feasible; rationalize the number of customers with a low volume or high cost-to-serve; or even divest the plant before margins deteriorate even further.
For producers in exporting regions such as the Middle East that were previously able to deliver to market at a lower cost that their competitors in that market, this situation means that they will need to look at their entire production and logistics costs to maintain competitiveness and market share. They may look to simply move more volumes to regions of a lower cost-to-serve and/or lower duties. On a production plant, a subtle shift in feedstock mix, minor modifications to reduce costs by just a few $/ton or pushing the plant to a slightly higher production would substantially move the competitive position due to the flat curve. This would, of course, set the plant up for an even better competitive position as oil prices rise.
In summary, the current very low oil price has created an opportunity for olefins and polyolefins complexes that have naphtha and LPG feedstocks. This opportunity may also allow time for projects and initiatives to improve longer term competitiveness. Cost and margin curves are essential for insight into a product chain and developing strategies in the immediate months and coming years. As such, this information should be part of the workflow for every producer.
Dr. Richard Charlesworth is an Executive Director supporting the global IHS Markit Technology & Analytics team as a Technical Subject Matter Expert for Chemicals & Refining. If you would like a demonstration of any of the IHS Markit Technology products, please contact him at richard.charlesworth@ihsmarkit.com
{"items" : [
{"name":"share","enabled":true,"desc":"<strong>Share</strong>","mobdesc":"Share","options":[ {"name":"facebook","url":"https://www.facebook.com/sharer.php?u=http%3a%2f%2fssl.ihsmarkit.com%2fcommodityinsights%2fen%2fci%2fresearch-analysis%2fbasic-chemicals--the-curve-is-already-flattened.html","enabled":true},{"name":"twitter","url":"https://twitter.com/intent/tweet?url=http%3a%2f%2fssl.ihsmarkit.com%2fcommodityinsights%2fen%2fci%2fresearch-analysis%2fbasic-chemicals--the-curve-is-already-flattened.html&text=Basic+Chemicals+-+The+Curve+is+Already+Flattened!+%7c+S%26P+Global+","enabled":true},{"name":"linkedin","url":"https://www.linkedin.com/sharing/share-offsite/?url=http%3a%2f%2fssl.ihsmarkit.com%2fcommodityinsights%2fen%2fci%2fresearch-analysis%2fbasic-chemicals--the-curve-is-already-flattened.html","enabled":true},{"name":"email","url":"?subject=Basic Chemicals - The Curve is Already Flattened! | S&P Global &body=http%3a%2f%2fssl.ihsmarkit.com%2fcommodityinsights%2fen%2fci%2fresearch-analysis%2fbasic-chemicals--the-curve-is-already-flattened.html","enabled":true},{"name":"whatsapp","url":"https://api.whatsapp.com/send?text=Basic+Chemicals+-+The+Curve+is+Already+Flattened!+%7c+S%26P+Global+ http%3a%2f%2fssl.ihsmarkit.com%2fcommodityinsights%2fen%2fci%2fresearch-analysis%2fbasic-chemicals--the-curve-is-already-flattened.html","enabled":true}]}, {"name":"rtt","enabled":true,"mobdesc":"Top"}
]}