Customer Logins
Obtain the data you need to make the most informed decisions by accessing our extensive portfolio of information, analytics, and expertise. Sign in to the product or service center of your choice.
Customer Logins
BLOG
May 20, 2020
Article: In Q1 Ecuador, China and PNG dominate canned tuna trade into the EU
Canned tuna trade flows during Q1 2020 shows stability among top players. However, the Covid-19 outbreak globally impacting industries out of China from March suggests a different scenario in Q2.
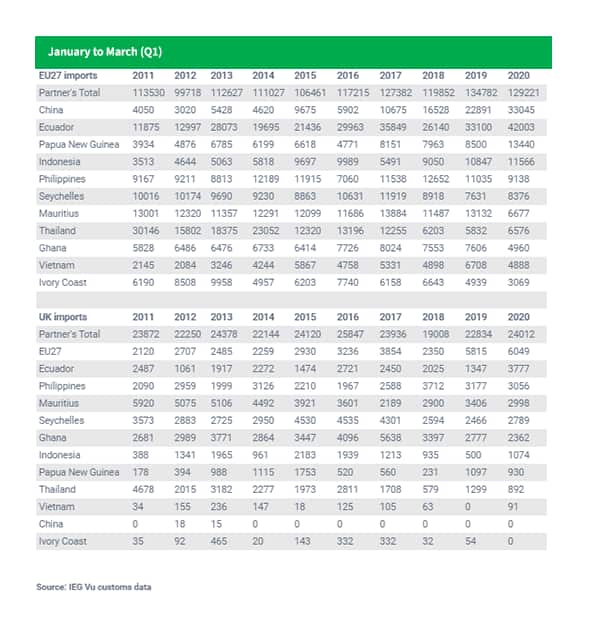
With April's customs trade data yet to be released, the latest update as of March 2020 shows top canned tuna supplier to the EU27 Ecuador challenged by increasing Chinese imports, a promising uptrend yet suddenly disrupted in February.
The outbreak effects quickly expanding worldwide, forcing lockdowns and world-wide sanitary measures that highly impacted canning activity in Ecuador from mid-March to date: trade to the EU27 and UK markets are said to be significantly diminished in April - customs data soon to be released.
However, Chinese tuna canning activities and trade resuming in March are likely to offset production gaps due to lockdowns, vessels' crew replacement and movement restrictions, impacting top tuna hubs in the last month.
So far, Papua New Guinea shipments into the EU27 are up 60% and the EU27 leading canned tuna supply into the UK are the highlights for Q1 2020.
Ecuador
Ecuadorian prepared tuna exports to the EU were up by a quarter in Q1: total volume reached 42,000 tonnes, of which 30% is precooked tuna loins. Average price fob customs data reports for the period is 13% down y-o-y.
Within the EU27, Spain received 38% of the total bulk, followed by The Netherlands (14.7%), Italy (9.8%), Germany and France (7% each); shipments to the UK shared 8.25% of the total.
China
EU27 and the UK imports from China in Q1 increased by 45% to 33,000 tonnes, of which 95.8% was "fillets known as loins of skipjack, prepared or preserved. Price fob was down 17% y-o-y.
Within the EU, Spanish imports represented 86% of the total, followed by Italy (5%); Chinese shipments to the UK were none.
The bulk of Chinese shipments was reported in January, as trade in February and March was completely disrupted - customs data reports fewer tonnes for February and March.
Papua New Guinea
EU27 and UK imports from Papua New Guinea, foremost source for MSC sustainable certified canned skipjack tuna products, reached record highs, increasing 58% during the January to March period to 14,500 tonnes. The average price customs data reports for the period is down 9.3% y-o-y.
The bulk of the exports, prepared or canned tuna, doubled in volumes from the previous period, to 5,000 tonnes.
Top EU27 destination, Germany, received 7,000 tonnes, followed by The Netherlands and Spain with 2,000 tonnes each. France and the UK received 1,000 tonnes each.
Indonesia
EU27 imports of canned tuna from Indonesia also increased during the period, by 11.4% to 11,000 tonnes. The bulk was equally shared between fillets known as loins of yellowfin and those of skipjack.
Italy, traditional top EU market for the Indonesian product, received 63% of the total bulk (7,800 tonnes).
The 37% left was shared between Spain, the UK, Portugal, France and the Netherlands.
Seychelles and Mauritius
While volumes from Seychelles were consistent compared with the previous year, those from Mauritius halved during the period.
Around 75% of the bulk was canned skipjack tuna and the 25% left was yellowfin canned tuna.
EU27 imports shared 75% of the total, with those into the UK sharing the 25% left.
Customs data reporting lower volumes from Seychelles, Mauritius, Ghana and Ivory Coast into the EU27 during the Q1 2020 is the result of not including the UK as an EU reporting country anymore since January this year due to Brexit.
Ghana and Ivory Coast
EU27 and UK canned tuna imports from Ghana and Ivory Coast totalled 10,400 tonnes for the period, down 32.5% y-o-y - customs data shows incomplete volumes for Ivory Coast as of May 15.
Volumes into the EU27 represented 77% of the total (mainly France and Germany), with those to the UK sharing the 23% left.
Around 23% of total volumes are related to canned yellowfin tuna, with the 77% left to canned skipjack tuna.
Thailand
EU27 imports from Thailand totalled 6,600 tonnes, up 12% y-o-y. The Netherlands was the top destination, sharing 28% of the total bulk, followed by France (21%).
Fewer volumes to secondary EU27 markets such as Germany (837 tonnes), Finland (338 tonnes), Sweden (237 tonnes), Greece (227 tonnes) are significant as show increases from previous years.
UK imports totalled 900 tonnes, similar with previous years.
Outlook
As of May 15, the global canned tuna market remains quiet and raw material prices for this commodity continue to decline.
A Chinese industry source noted today (May 15): "Customers are asking us to wait for new orders, they want to check with supermarkets whether more stocks are expected to be needed […] They are not buying fiercely right know, so I believe new orders will come as soon as stocks start to be cleared […] Actually, the EU market is becoming more active these days."
EU27 and UK prepared tuna imports Q1 yearly comparisonChina becomes top prepared tuna supplier to the EU27 as the EU27 is to the UK
This article was published by S&P Global Commodity Insights and not by S&P Global Ratings, which is a separately managed division of S&P Global.
{"items" : [
{"name":"share","enabled":true,"desc":"<strong>Share</strong>","mobdesc":"Share","options":[ {"name":"facebook","url":"https://www.facebook.com/sharer.php?u=http%3a%2f%2fssl.ihsmarkit.com%2fcommodityinsights%2fen%2fci%2fresearch-analysis%2farticle-in-q1-ecuador-china-and-png-dominate-canned-tuna-trade.html","enabled":true},{"name":"twitter","url":"https://twitter.com/intent/tweet?url=http%3a%2f%2fssl.ihsmarkit.com%2fcommodityinsights%2fen%2fci%2fresearch-analysis%2farticle-in-q1-ecuador-china-and-png-dominate-canned-tuna-trade.html&text=Article%3a+In+Q1+Ecuador%2c+China+and+PNG+dominate+canned+tuna+trade+into+the+EU+%7c+S%26P+Global+","enabled":true},{"name":"linkedin","url":"https://www.linkedin.com/sharing/share-offsite/?url=http%3a%2f%2fssl.ihsmarkit.com%2fcommodityinsights%2fen%2fci%2fresearch-analysis%2farticle-in-q1-ecuador-china-and-png-dominate-canned-tuna-trade.html","enabled":true},{"name":"email","url":"?subject=Article: In Q1 Ecuador, China and PNG dominate canned tuna trade into the EU | S&P Global &body=http%3a%2f%2fssl.ihsmarkit.com%2fcommodityinsights%2fen%2fci%2fresearch-analysis%2farticle-in-q1-ecuador-china-and-png-dominate-canned-tuna-trade.html","enabled":true},{"name":"whatsapp","url":"https://api.whatsapp.com/send?text=Article%3a+In+Q1+Ecuador%2c+China+and+PNG+dominate+canned+tuna+trade+into+the+EU+%7c+S%26P+Global+ http%3a%2f%2fssl.ihsmarkit.com%2fcommodityinsights%2fen%2fci%2fresearch-analysis%2farticle-in-q1-ecuador-china-and-png-dominate-canned-tuna-trade.html","enabled":true}]}, {"name":"rtt","enabled":true,"mobdesc":"Top"}
]}