Customer Logins
Obtain the data you need to make the most informed decisions by accessing our extensive portfolio of information, analytics, and expertise. Sign in to the product or service center of your choice.
Customer Logins
BLOG
Mar 20, 2019
Fast and reliable analysis for gas lifted wells
How can gas lifted wells be evaluated in an easy and quickly manner?
Gas lift is a traditional artificial lift system that helps oil and gas wells lift fluids from the bottom of the well to the surface when there is not enough energy to do this in a natural manner.
In this type of production system, gas is typically injected into the annular space at the lower part of the tubing string. This results in a reduction of the flowing gradient in the production string which leads to a drawdown (ΔP) increase on the production formation while improving well production.
Typical tasks involving the evaluation of these wells are listed here:
- Calculation of inflow performance relationship (IPR) and outflow (TPC, VLP or VFP) curves.
- Analysis of reservoir and well changes during its producing life. (e.g. reservoir pressure, skin, tubing and casing pressures, flow regime, etc).
- Evaluation of the compression process.
- Analysis of gas liquid ratios.
- Assessments of pressure traverse changes.
- Estimation of the well potential.
Evaluating these types of wells is not always an easy task for production engineers because injecting too much gas can add friction that could end up in an increment of the back pressure inside the well. This leads to a waste of money on compression costs. On the other hand, injecting too little gas can leave valuable production behind if the lower gas lift valves are not opened.
Fortunately, the PERFORM software from IHS Markit is very useful for these types of analyses, since it can model well performance using the nodal analysis technique and has several built-in tools to sensitize production and reservoir parameters. In this post, the author will discuss some graphs to consider for fast and reliable gas lift analyzes.
Nodal Analysis
The easiest way to start evaluating these wells is through the analysis of the flowing bottomhole pressure and their corresponding rates. This can be achieved by applying the nodal analysis technique in the bottom of the well at the current - or last known - operating conditions.
The resulting IPR (Inflow Performance Relationship) curve will help you understand the current maximum rate the reservoir can deliver to the well. A well capable of producing fluids will exhibit intersecting outflow and IPR curves. In contrast, a missing intersection between these curves will indicate the differential pressure required to lift the fluids to the surface, sometimes referred to in the field as "lack of energy". Figure 1 shows this type of analysis.
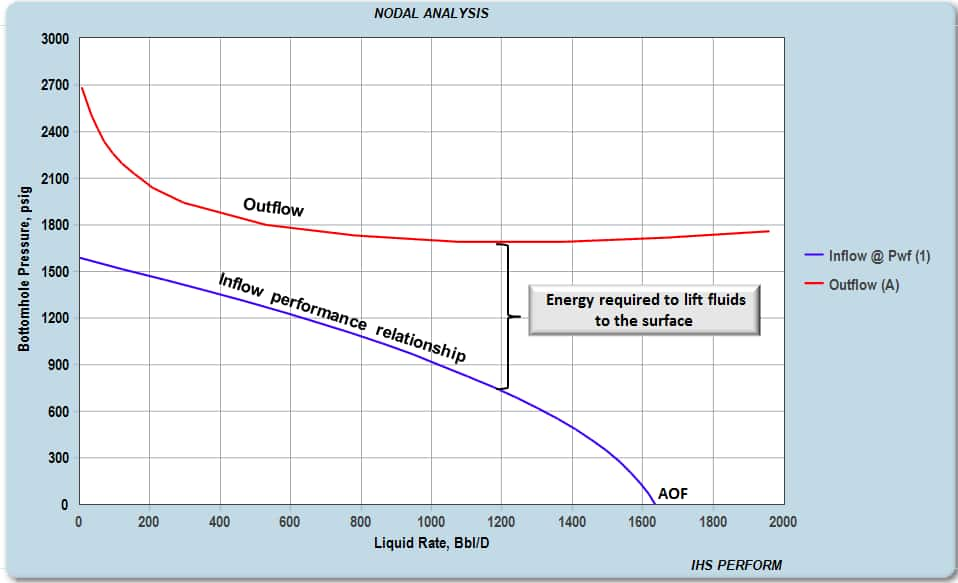
Figure 1: Nodal analysis in an oil well that requires artificial lift
At this point, it is beneficial to evaluate and propose different forms of artificial lift (i.e., Gas lift, ESP's, PCP's, Plungers, Sucker Rod Pumps, Jet Pumps). The typical proposal includes a design of the artificial system customized to the well conditions and describes how the "new well" would operate. After this, the installation of the artificial system proceeds.
With Gas Lift already selected as a suitable form of artificial lift and valves installed at the most convenient depths, a comparison of hypothetical injection gas rate scenarios and the original well condition - at any time - becomes very valuable to determine the impact on the production rate. Figure 2 shows an example of the expected rates under five (5) assumed injection rate scenarios. Being ~1,200 BPD the result of injecting 3 MMscfd on this well.
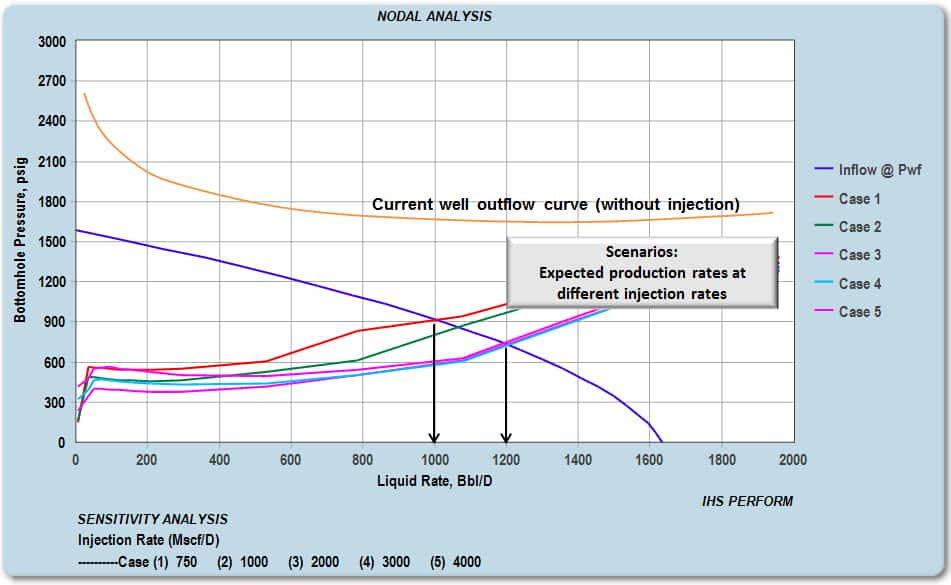
Figure 2: Nodal Analysis applying hypothetical gas lift injection rates
Once this information is known, injection rates and production rates can be plotted (Figure 3). This is a very useful graph since its main objective is to help identify the maximum rate, the technical optimum injection rate, and the economic optimum injection rate (the injection rate where extra injection costs balance extra production revenue).
Because the gas lift has a small window to operate efficiently, injecting more gas at some point may end up in a lower production rate; this behavior is typically observed after reaching the maximum technical rate. The reason behind this is the increment in friction due to a greater volume flowing in the tubing which is faster than the counterbalanced reduction in the hydrostatic term in the pressure loss calculation.
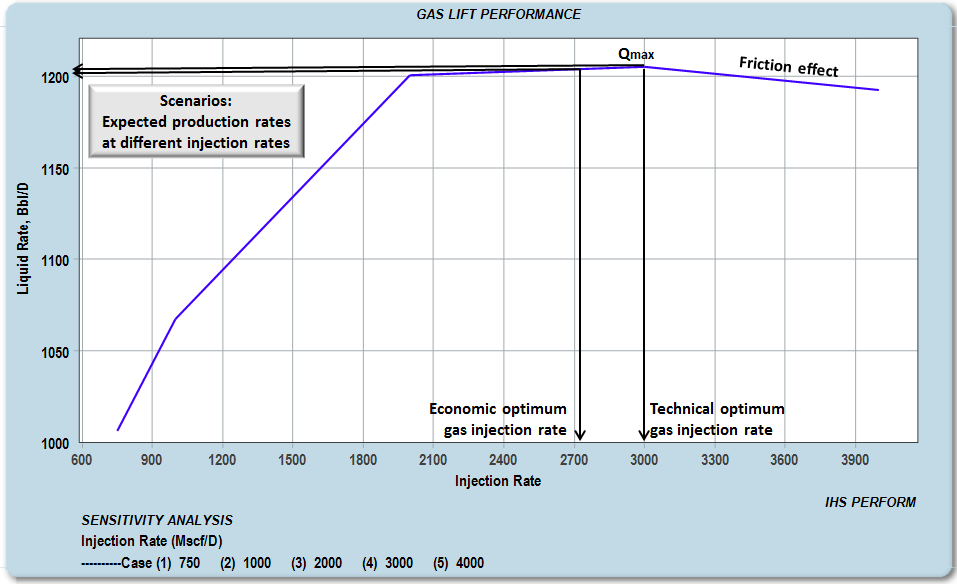
Figure 3: Analysis of Gas injection rates
Alternatively, the resulting gas liquid ratio calculated from each hypothetical injection rate scenario can be plotted against the production rate. As expected, Figure 4 shows a maximum production rate of ~1200 BPD.
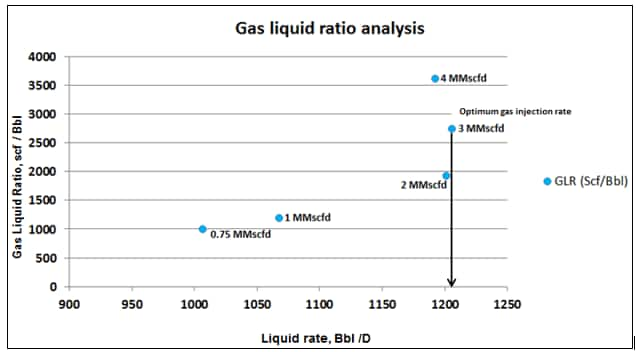
Figure 4: Gas liquid ratio analysis
Often, reservoir parameters change due to stimulations, fracking, skin, etc. These changes will affect the IPR curve. Therefore, the maximum rate (AOF) originally calculated in Figure 1 will also be modified.
Figure 5 shows five (5) scenarios in flowing pressures affected by reservoir performance assumptions and five (5) hypothetical injection rates. The outcome is a nodal analysis with a total of twenty-five (25) potential production rates.
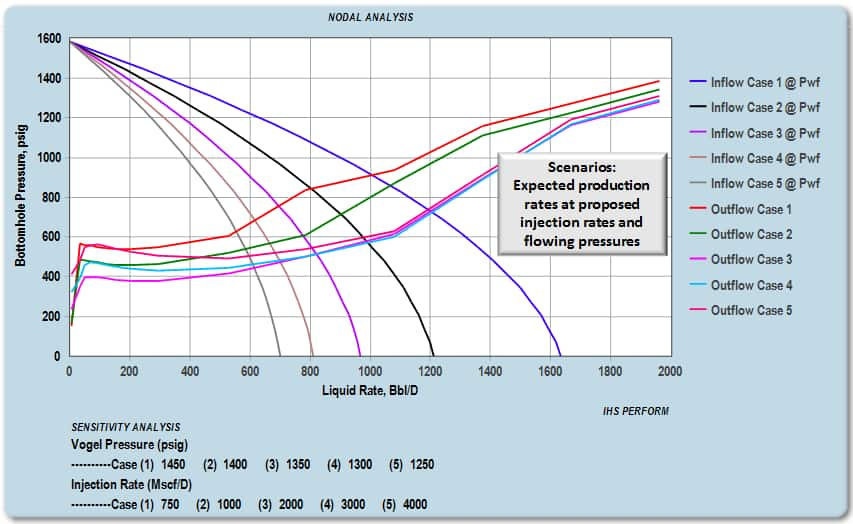
Figure 5: Expected rates of reservoir changes with different injection rates
A less traditional graph showing the same twenty-five (25) potential outcomes is shown in Figure 6. In this graph, it can be observed that the optimum gas injection rate remains the same for most of the proposed scenarios despite the loss in productivity due to reservoir changes. Any increment on the injection rate after the maximum technical rate will attempt to decrease the production rate due to friction effects in the well.
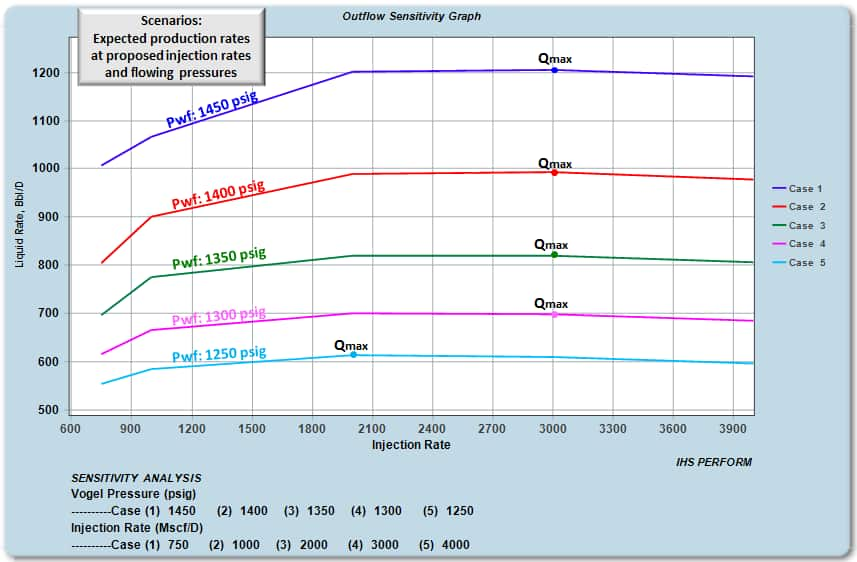
Figure 6: Production rates analysis
Sensitivities can also be done in the tubing diameter to understand how much the well would produce if these changes occur in the future. Figure 7 shows differences in these production rates at a specified injection rate. As it can be seen, the production increases rapidly as the tubing OD increases from 2 ⅜" to 3 ½".
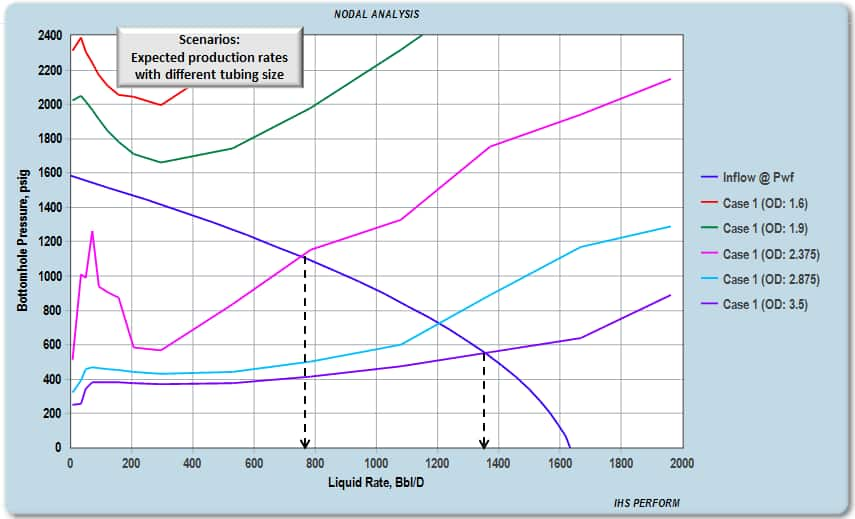
Figure 7: Effect of changing the tubing size
Lastly, selecting an appropriate multiphase flow correlation in the modeling of these cases is critical. A correlation for a gas lifted well may be different from that one previously selected to describe the same well performance when it was producing under natural flow conditions. Figure 8 shows how the use of an improper correlation can lead to an incorrect prediction of the well production rate at a specified injection rate.
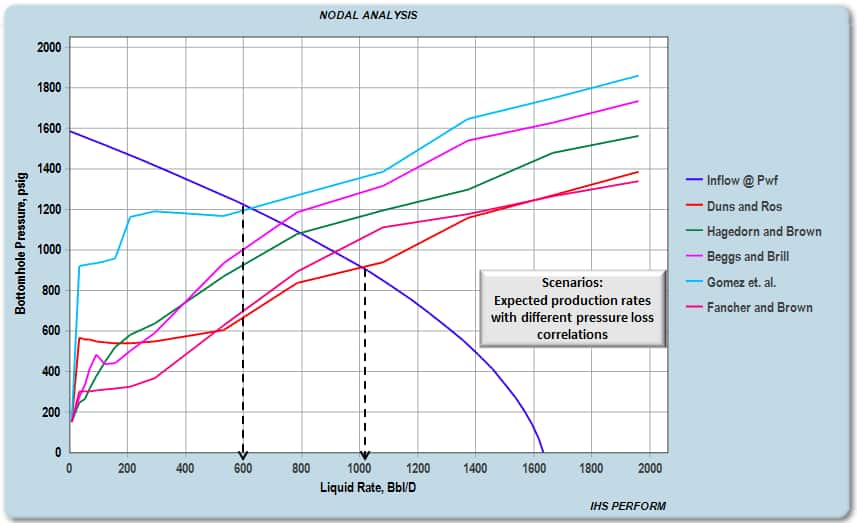
Figure 8: Effect of multiphase flow correlations
In conclusion, due to the dynamic nature of gas lifted wells, a robust and reliable model that represents all the above discussed variables is always valuable, as this will play a critical role in the field optimization process.
Learn more about our solutions for well performance analysis.
Adriana Hernandez is a Technical Advisor in Engineering at IHS Markit.
Posted 20 March 2019
This article was published by S&P Global Commodity Insights and not by S&P Global Ratings, which is a separately managed division of S&P Global.
{"items" : [
{"name":"share","enabled":true,"desc":"<strong>Share</strong>","mobdesc":"Share","options":[ {"name":"facebook","url":"https://www.facebook.com/sharer.php?u=http%3a%2f%2fssl.ihsmarkit.com%2fcommodityinsights%2fen%2fci%2fresearch-analysis%2fanalysis-for-gas-lifted-wells.html","enabled":true},{"name":"twitter","url":"https://twitter.com/intent/tweet?url=http%3a%2f%2fssl.ihsmarkit.com%2fcommodityinsights%2fen%2fci%2fresearch-analysis%2fanalysis-for-gas-lifted-wells.html&text=Fast+and+reliable+analysis+for+gas+lifted+wells+%7c+S%26P+Global+","enabled":true},{"name":"linkedin","url":"https://www.linkedin.com/sharing/share-offsite/?url=http%3a%2f%2fssl.ihsmarkit.com%2fcommodityinsights%2fen%2fci%2fresearch-analysis%2fanalysis-for-gas-lifted-wells.html","enabled":true},{"name":"email","url":"?subject=Fast and reliable analysis for gas lifted wells | S&P Global &body=http%3a%2f%2fssl.ihsmarkit.com%2fcommodityinsights%2fen%2fci%2fresearch-analysis%2fanalysis-for-gas-lifted-wells.html","enabled":true},{"name":"whatsapp","url":"https://api.whatsapp.com/send?text=Fast+and+reliable+analysis+for+gas+lifted+wells+%7c+S%26P+Global+ http%3a%2f%2fssl.ihsmarkit.com%2fcommodityinsights%2fen%2fci%2fresearch-analysis%2fanalysis-for-gas-lifted-wells.html","enabled":true}]}, {"name":"rtt","enabled":true,"mobdesc":"Top"}
]}

