Customer Logins

Obtain the data you need to make the most informed decisions by accessing our extensive portfolio of information, analytics, and expertise. Sign in to the product or service center of your choice.

Customer Logins

My Logins

All Customer Logins
S&P Global
Explore S&P Global
  • S&P Global
  • S&P Dow Jones Indices
  • S&P Global Market Intelligence
  • S&P Global Mobility
  • S&P Global Commodity Insights
  • S&P Global Ratings
  • S&P Global Sustainable1
Close
Discover more about S&P Global’s offerings.
Investor Relations
  • Investor Relations Overview
  • Presentations
  • Investor Fact Book
  • News Releases
  • Quarterly Earnings
  • SEC Filings & Reports
  • Executive Committee
  • Merger Information
  • Governance
  • Stock & Dividends
  • Shareholder Services
  • Contact
English
  • Español
  • 中文网站
  • Português
  • 한국어
  • हिंदी
  • 日本語
Support
  • Get Support
  • System Notifications
  • Delivery Platforms
  • Regulatory Engagement
Login
  • Commodity Insights Login
  • Access IHS Markit Products
Register
logo Commodity Insights
  • Commodities
  • Products & Solutions
  • News & Research
  • Pricing & Benchmarks
  • Events
  • Sustainable1
  • Who We Are
  • S&P Global
  • S&P Dow Jones Indices
  • S&P Global Market Intelligence
  • S&P Global Mobility
  • S&P Global Commodity Insights
  • S&P Global Ratings
  • S&P Global Sustainable1
  • Oil Upstream LNG Natural Gas Electric Power Coal Shipping Chemicals Metals Agriculture
    Latest in Commodities
    Listen: Change Makers: Rodney Clemente, Energy Recovery

    Energy Recovery, with roots in the desalination industry, designs and manufactures energy-efficiency...

    India woos upstream oil and gas investors with changes on revenue sharing, fiscal incentives

    India has unveiled a new set of policies for its oil and gas sector, under which it aims to offer a...

    PACIFIC LNG: Key market indicators for July 14-18

    Platts JKM, the benchmark price reflecting LNG delivered to Northeast Asia, is expected to stay firm...

  • Agriculture & Food Biofuels Chemicals Fertilizers Clean Energy Technology Gas & Power Crude Oil Fuels & Refined Products LNG Steel & Metals Upstream & Midstream (Oil & Gas) Crop Science Carbon & Scenarios Shipping
    Capabilities
    Market Insights and Analytics CI Consulting Commodity Prices and Essential Market Data Real-Time News, Prices and Analysis Forward Curves and Risk Valuation Data
    Data and Distribution
  • Latest News Headlines All Topics Videos Podcasts Special Reports Infographics Insight Blog    Commodity Insights Magazine Commodity Insights LIVE
  • Our Methodology Methodology & Specifications Price Assessments Subscriber Notes Price Symbols Symbol Search & Directories Corrections Complaints
    References
    Market On Close Index Methodology Review & Change MOC Participation Guidelines Holiday Dunl.org SEE ALL REFERENCE TOOLS
  • All Events Webinars Conferences Methodology Education Training and eLearning Forums Conferences Live Global Energy Awards    CERAWeek
    Featured Events
    Webinars Watt's new in the current affairs of Battery Metals
    • 28 Aug 2025
    • Online
    Webinars APPEC 2025
    • 28 Aug 2025
    • Online
    Webinar Madrid Market Briefing
    • 16 Sep 2025
    • Madrid, Spain
  • Overview Contact Us Regulatory Engagement & Market Issues Commodity Insights LIVE

Nitrobenzene and Aniline

Chemical Economics Handbook

View Report for existing customers Go to Customer Login for existing customers
Learn more about Nitrobenzene and Aniline
Contact Sales
Contact Sales +1 844 301 7334

Published May 2022

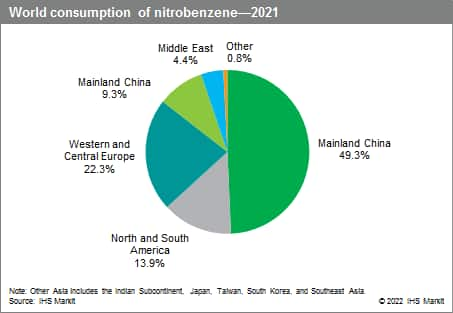
Mainland China is the largest player in the nitrobenzene market, representing 49% of global nitrobenzene consumption in 2021. Mainland China is the dominant force in Northeast Asia, accounting for 84% of the region’s nitrobenzene demand. Western Europe is the second-largest market for nitrobenzene and represents 20% of global nitrobenzene demand as of 2021. Demand for nitrobenzene in Western Europe is forecast to grow at an average annual rate of 2.3% during the forecast period, reaching over 2.1 million metric tons of nitrobenzene consumption in 2026. The United States is the third-largest nitrobenzene market, contributing almost 14% of global consumption in 2021. Demand for nitrobenzene in the United States is forecast to grow at an annual rate of 4.1% during 2021–26, reaching near 1.5 million metric tons by the end of the forecast period. Demand for nitrobenzene in the United States is closely linked to US consumption of aniline. US housing starts and construction/remodeling activity drive the demand for MDI. US nitrobenzene consumption for aniline is projected to grow at an average annual rate of 4.1% per year during the forecast period.

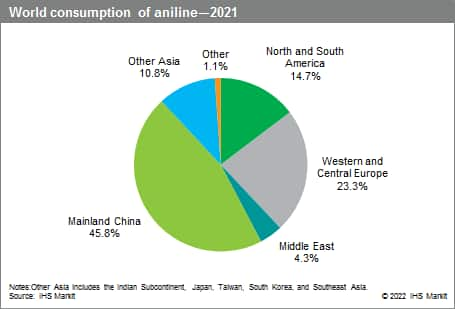
During 2016–21, global aniline consumption grew at an average annual rate of 3.2%, reaching more than 6.8 million metric tons in 2021. MDI global consumption grew by 3.9% per year during the same period, reaching over 7.4 million metric tons in 2021. The global demand for MDI is expected to increase by 3.8% per year during the forecast period. In turn, aniline consumption for MDI will grow at an average annual rate of 3.8% during 2021–26.

The following charts present world consumption of nitrobenzene and aniline:

For more detailed information, see the table of contents, shown below.

S&P Global’s Chemical Economics Handbook – Nitrobenzene and Aniline is the comprehensive and trusted guide for anyone seeking information on this industry. This latest report details global and regional information, including

Key Benefits

S&P Global’s Chemical Economics Handbook – Nitrobenzene and Aniline has been compiled using primary interviews with key suppliers and organizations, and leading representatives from the industry in combination with S&P Global’s unparalleled access to upstream and downstream market intelligence and expert insights into industry dynamics, trade, and economics.

This report can help you

  • Identify trends and driving forces influencing chemical markets
  • Forecast and plan for future demand
  • Understand the impact of competing materials
  • Identify and evaluate potential customers and competitors
  • Evaluate producers
  • Track changing prices and trade movements
  • Analyze the impact of feedstocks, regulations, and other factors on chemical profitability
Buy individual report now Contact:
customercare@ihsmarkit.com
Find the chemical expertise you need Contact a chemical expert or request a demo today.
GET STARTED

Contents

Executive Summary 7
Nitrobenzene 7
Aniline 8
Summary 9
Nitrobenzene 9
Producing companies 10
Consumption 11
Aniline 11
Producing companies 13
Consumption 14
Introduction 16
Nitrobenzene 16
Aniline 16
Manufacturing processes 18
Nitrobenzene 18
Direct nitration process 18
Dehydrating nitration process 18
Adiabatic nitration process 18
Aniline 19
Environmental issues 21
Nitrobenzene 21
Aniline 21
United States 21
Western Europe 21
Supply and demand by region 22
North America 22
Overview 22
Nitrobenzene 22
Aniline 22
United States 22
Producing companies 22
Nitrobenzene 22
Aniline 23
Salient statistics 24
Nitrobenzene 24
Aniline 25
Consumption 26
Trade 27
Canada 27
Mexico 28
Producing companies 28
Nitrobenzene 28
Aniline 28
Salient statistics 28
Nitrobenzene 28
Aniline 29
South America 30
Producing companies 30
Nitrobenzene 30
Aniline 30
Salient statistics 30
Nitrobenzene 30
Aniline 31
Consumption 32
Trade 32
Western Europe 32
Producing companies 33
Nitrobenzene 33
Aniline 34
Salient statistics 35
Nitrobenzene 35
Aniline 35
Consumption 36
MDI 37
Non-MDI uses 37
Trade 37
Central Europe 38
Producing companies 38
Nitrobenzene 38
Aniline 38
Salient statistics 39
Nitrobenzene 39
Aniline 39
Consumption 40
MDI 41
Non-MDI uses 42
Trade 42
CIS and Baltic States 42
Producing companies 42
Nitrobenzene 42
Aniline 43
Salient statistics 43
Nitrobenzene 43
Aniline 44
Consumption 44
Trade 45
Middle East and Africa 45
Producing companies 46
Nitrobenzene 46
Aniline 46
Salient statistics 47
Nitrobenzene 47
Aniline 47
Trade 48
Indian Subcontinent 48
Producing companies 48
Nitrobenzene 48
Aniline 49
Salient statistics 49
Nitrobenzene 49
Aniline 50
Consumption 51
Trade 51
Northeast Asia 51
Overview 52
Nitrobenzene 52
Salient statistics 52
Consumption 52
Aniline 53
Salient statistics 53
Consumption 54
Mainland China 55
Producing companies 55
Nitrobenzene 55
Aniline 56
Salient statistics 58
Nitrobenzene 58
Aniline 58
Consumption 59
MDI 61
Non-MDI uses 61
Trade 62
Japan 62
Producing companies 62
Nitrobenzene 62
Aniline 62
Salient statistics 63
Nitrobenzene 63
Aniline 63
Consumption 64
Trade 65
South Korea 65
Producing companies 65
Nitrobenzene 65
Aniline 66
Salient statistics 66
Nitrobenzene 66
Aniline 67
Consumption 68
Taiwan 69
Consumption 69
Trade 69
Southeast Asia 70
Additional resources 71
Revisions 73
Data Workbook 74
Notice 75
{"items" : [ {"name":"share","enabled":true,"desc":"<strong>Share</strong>","mobdesc":"Share","options":[ {"name":"facebook","url":"https://www.facebook.com/sharer.php?u=http%3a%2f%2fssl.ihsmarkit.com%2fcommodityinsights%2fen%2fci%2fproducts%2fnitrobenzene-and-aniline-chemical-economics-handbook.html","enabled":true},{"name":"twitter","url":"https://twitter.com/intent/tweet?url=http%3a%2f%2fssl.ihsmarkit.com%2fcommodityinsights%2fen%2fci%2fproducts%2fnitrobenzene-and-aniline-chemical-economics-handbook.html&text=Nitrobenzene+and+Aniline+-+Chemical+Economics+Handbook+(CEH)+%7c+S%26P+Global","enabled":true},{"name":"linkedin","url":"https://www.linkedin.com/sharing/share-offsite/?url=http%3a%2f%2fssl.ihsmarkit.com%2fcommodityinsights%2fen%2fci%2fproducts%2fnitrobenzene-and-aniline-chemical-economics-handbook.html","enabled":true},{"name":"email","url":"?subject=Nitrobenzene and Aniline - Chemical Economics Handbook (CEH) | S&P Global&body=http%3a%2f%2fssl.ihsmarkit.com%2fcommodityinsights%2fen%2fci%2fproducts%2fnitrobenzene-and-aniline-chemical-economics-handbook.html","enabled":true},{"name":"whatsapp","url":"https://api.whatsapp.com/send?text=Nitrobenzene+and+Aniline+-+Chemical+Economics+Handbook+(CEH)+%7c+S%26P+Global http%3a%2f%2fssl.ihsmarkit.com%2fcommodityinsights%2fen%2fci%2fproducts%2fnitrobenzene-and-aniline-chemical-economics-handbook.html","enabled":true}]}, {"name":"rtt","enabled":true,"mobdesc":"Top"} ]}
Filter Sort
  • About S&P Global Commodity Insights
  • Media Center
  • Advertisers
  • Careers
  • Contact Us
  • History
  • Glossary
  • S&P Global Inc.
  • Our Values
  • Overview
  • Investor Relations
  • Customer Care & Sales
  • Careers
  • Our History
  • News Releases
  • Support by Division
  • Get Support
  • Corporate Responsibility
  • Ventures
  • Quarterly Earnings
  • Report an Ethics Concern
  • Leadership
  • Press
  • SEC Filings & Reports
  • Office Locations
  • IOSCO ESG Rating & Data Product Statements
  • © 2025 by S&P Global Inc. All rights reserved.
  • Terms of Use
  • Cookie Notice
  • Privacy Policy
  • Client Privacy Portal
  • Do Not Sell My Personal Information
  • Site Map