Customer Logins

Obtain the data you need to make the most informed decisions by accessing our extensive portfolio of information, analytics, and expertise. Sign in to the product or service center of your choice.

Customer Logins

My Logins

All Customer Logins

LNG Analytics

Learn more about LNG Analytics

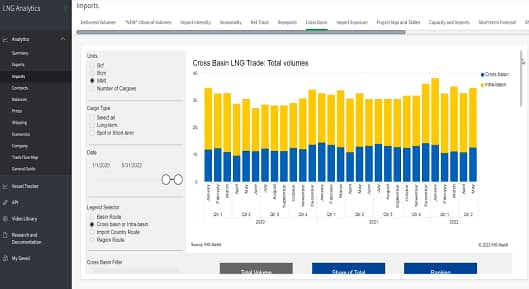
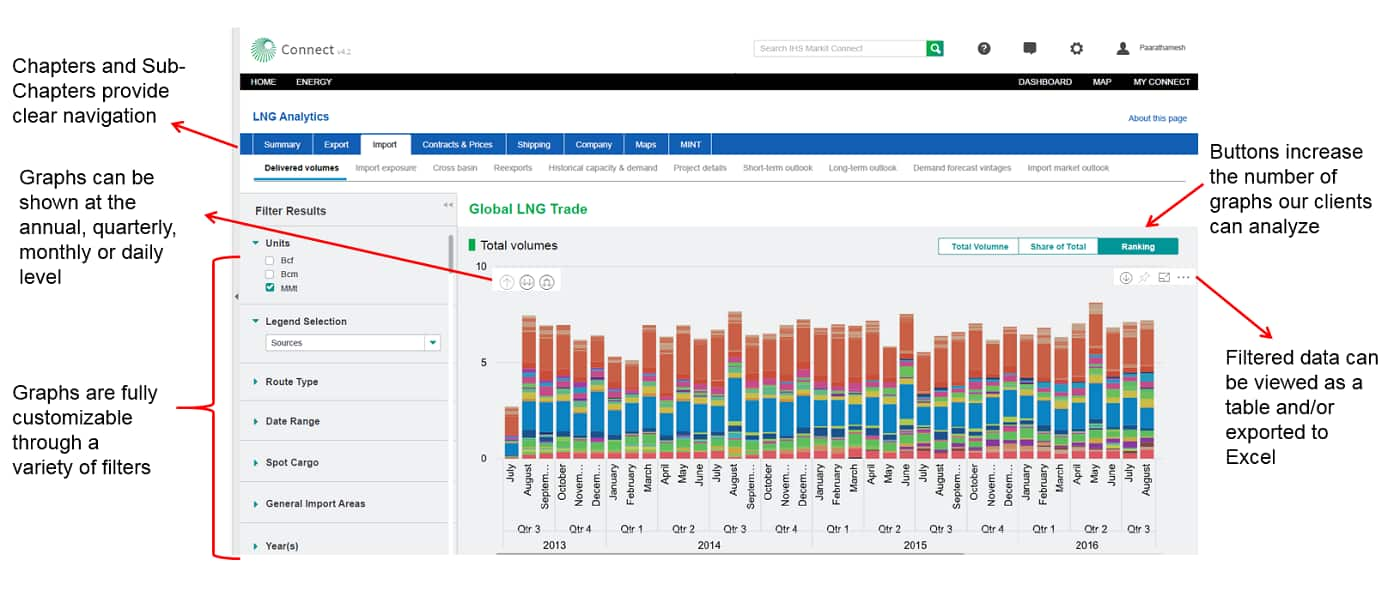
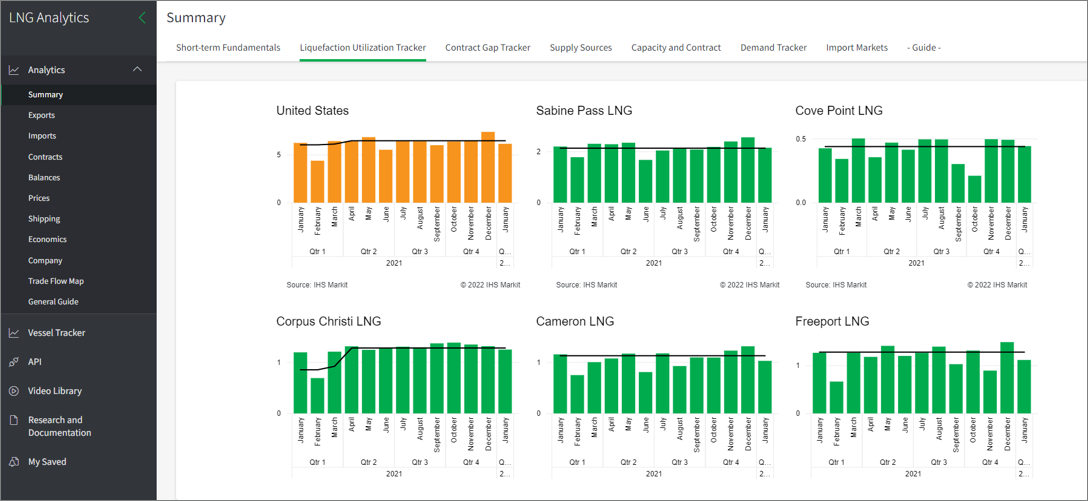
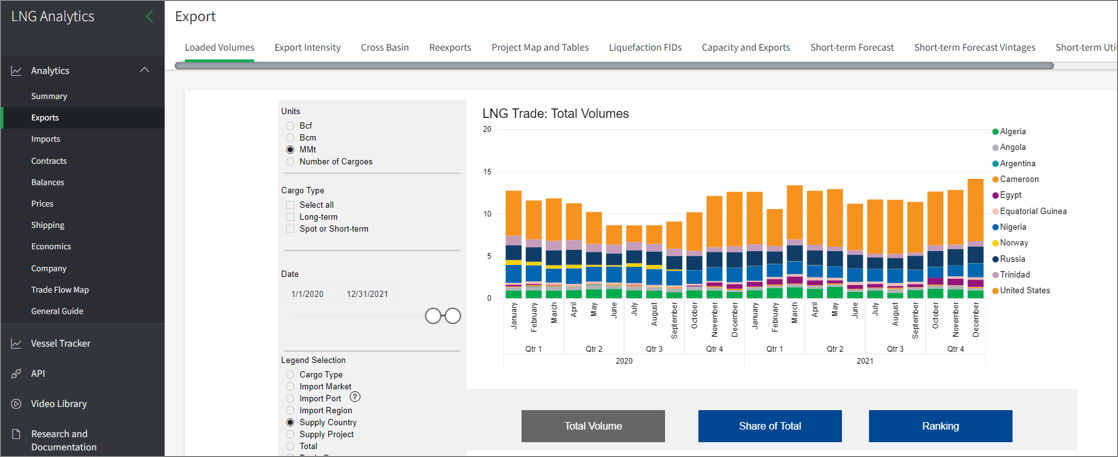
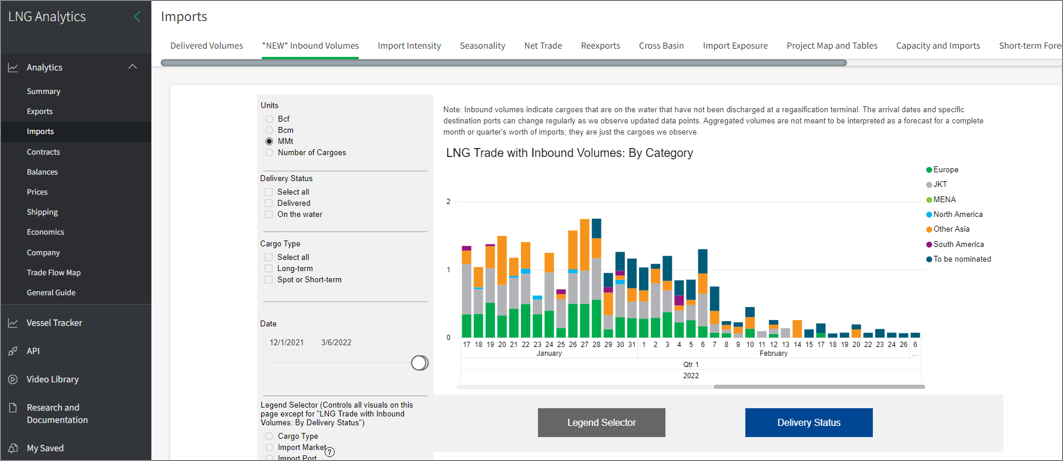
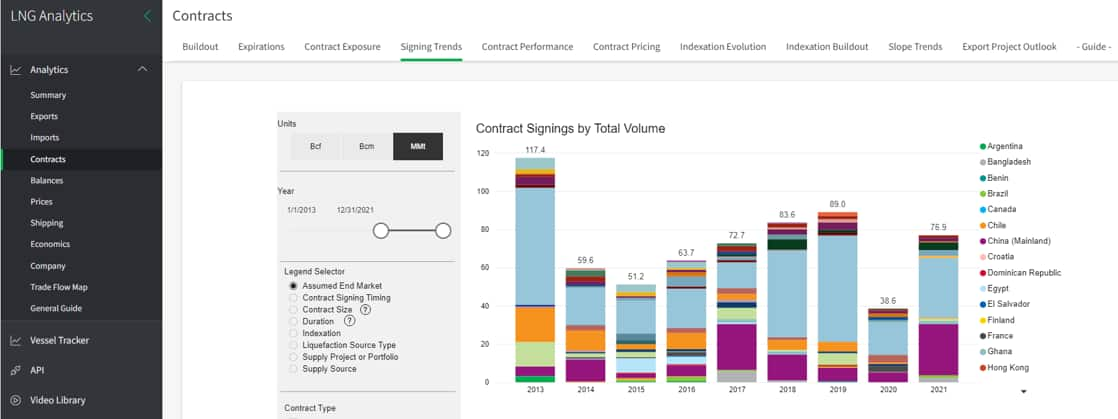
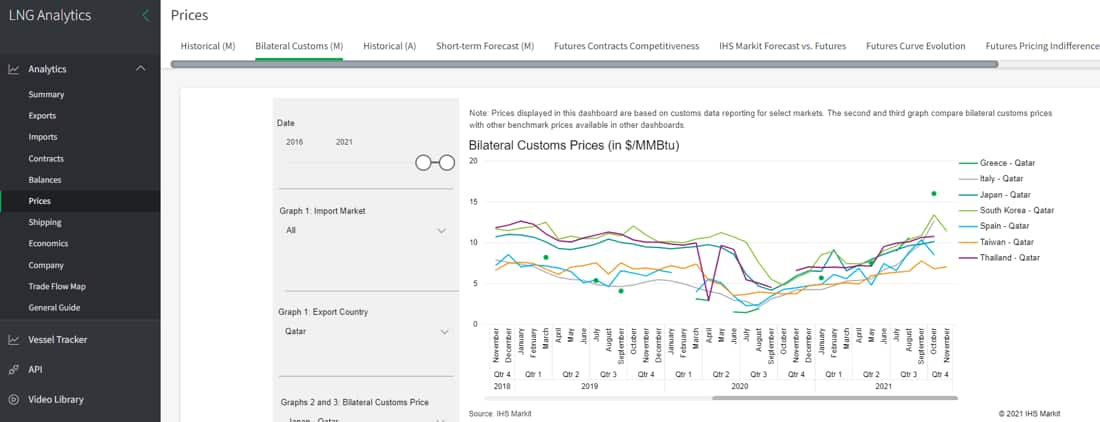
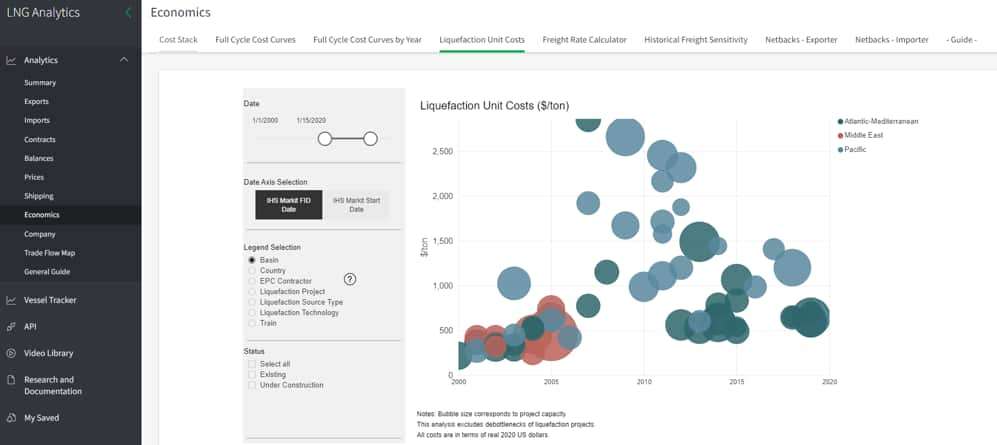
LNG market conditions have experienced major change in recent years, moving from extreme price lows during oversupply in mid-2020 to extreme price highs in 2021 as demand rapidly recovered from the outbreak of COVID-19. Spot LNG prices have soared past previous records, and with limited new supply additions over the next few years, prices are likely to remain elevated. As the market responds to these new realities, real-term trade dynamics will grow in importance and will evolve relative to historical norms.

In the face of growing market size and complexity, our global LNG predictive analytics interactive platform allows you to customize your analysis so you can more accurately interpret and take advantage of market trends. Create customized queries that connect our real-time cargo data with LNG supply, demand and price outlooks, along with the latest information on assets and contracts. Perform benchmarking analysis with historical and forward-looking data.

Key benefits:

  • Streamline workflows while increasing the sophistication of your analysis
  • Keep pace with the fast-changing scale and complexity of the industry
  • Spend more time on value-added strategic decisions
  • Boost efficiency with seamless access to LNG analytics through our state-of-the-art business intelligence platform, Connect
See how LNG Analytics can improve your workflow
FREE TRIAL


LNG trade flow and shipping market gyrations in 2022


Liquified Natural Gas Predictive Analytics Dashboard

User-friendly interface (click to enlarge image)

Categories and Coverage

Summary
  • Short-term fundamentals of the LNG market: Summarized charts of key trends
  • Liquefaction utilization tracker: Quick reference of all projects
  • Contract gap tracker: Quick reference of all markets
  • Supply sources: Holistic view of a single supply source
  • Capacity and contracts: Summarized charts of key trends
  • Demand tracker: Quick reference of all markets
  • Import markets: Holistic view of a single market

click to enlarge image

Example: Liquefaction Utilization Tracker showing select US projects.

LNG Exports
  • LNG trade: Loaded volumes
  • Export intensity: Daily export levels vs. customizable running average
  • Cross-basin LNG trade: Loaded volumes
  • Reexports: Loaded reexport volumes
  • Liquefaction project and contract tables and map
  • Liquefaction FIDs: Historical and forecast
  • Capacity and exports: Historical liquefaction utilization
  • Short-term (5 year) monthly forecast: LNG supply and liquefaction capacity
  • Short-term (5 year) forecast: Vintages vs. current
  • Short-term (5 year) monthly forecast: Liquefaction utilization
  • Long-term (to 2050) annual forecast: LNG supply and liquefaction capacity

click to enlarge image

Loaded LNG volumes from liquefaction projects in Middle East and North Africa (MENA).

LNG Imports
  • LNG trade: Delivered volumes
  • Inbound volumes: Historical delivered imports & volumes currently on the water
  • Import intensity: Daily import levels vs. customizable running average
  • Seasonality: Year of year monthly comparison of imports
  • Net trade: Delivered imports net of loaded reexports
  • Reexports: Delivered reexport volumes
  • Cross-basin LNG trade: Delivered volumes
  • Import exposure: Comparison of import exposure to supply sources
  • Regasification project and capacity tables and map
  • Capacity and imports: Historical regasification utilization
  • Short-term (5 year) monthly forecast: LNG imports and capacity
  • Short-term (5 year) forecast: Vintages vs. current
  • Long-term (to 2050) annual forecast: LNG imports
  • Regasification forecast: Expected regasification needs for import markets

click to enlarge image

Example: Inbound LNG volumes by region.

LNG Contracts
  • Contract Buildout and contract expirations
  • Contract Exposure: Comparison of market exposure to contract types
  • Contract Signing Trends
  • Contract Performance: Analysis of contracts vs. loaded volumes
  • Contract Pricing Terms
  • Contract Indexation Evolution
  • Contract Indexation Buildout
  • Contract Slope Trends
  • Export Project Outlook

click to enlarge image

Example: Contract signing by end market.

LNG Balances
  • Short-term (5 year) LNG monthly contract/demand gap
  • Long-term (to 2050) LNG annual contract/demand gap
  • Short-term (5 year) LNG monthly supply/demand balance
  • Long-term (to 2050) LNG annual supply/demand balance
  • Scenarios to 2050: LNG demand
  • Scenarios to 2050: LNG supply
  • Scenarios to 2050: LNG in transportation

click to enlarge image

Example: Long-term supply/demand balance by import region.

LNG Prices
  • Monthly historical LNG and gas prices, as well as weekly landed spot LNG prices
  • Monthly bilateral customs prices for select markets
  • Annual historical bilateral and average prices for select markets
  • Short-term monthly LNG price forecast
  • Futures contracts competitiveness
  • Short-term price forecast vs. forward curves
  • Futures curve evolution
  • Futures pricing indifference curves
  • Long-term (to 2050) annual LNG price forecast
  • LNG trade vs. historical LNG prices

click to enlarge image

Example: Bilateral LNG customs prices of Qatari supply

LNG Shipping
  • LNG trade by vessel
  • Idle laden and ballast tanker analysis
  • FSRU availability
  • FSRU details
  • Historical and forecast LNG vessel charter rates
  • Vessel state trends
  • LNG shipping vessel details and tables
  • LNG fleet evolution
  • Historical speed of the LNG fleet
  • Ton-mileage demand
  • Distances by project
  • Cross-basin LNG trade by vessel
  • LNG vessel charter rates vs. trade
  • LNG vessel charter rates vs. cross-basin LNG trade

click to enlarge image

Idle LNG vessel analysis

LNG Economics
  • Breakeven cost stack of liquefaction projects
  • Full cycle cost curves of liquefaction projects
  • Full cycle cost curves of liquefaction projects by year
  • Liquefaction unit costs
  • Freight rate calculator
  • Historical freight sensitivity
  • Netbacks for select exporters
  • Netbacks for select importers

click to enlarge image

Example: Liquefaction unit costs by region

LNG Companies
  • LNG trade by company
  • Contract portfolios by company
  • Contract expirations by company
  • Contract benchmarking by company
  • Liquefaction portfolios by company
  • Liquefaction benchmarking by company
  • Cross-basin LNG trade by company
  • Regasification portfolios by company
  • Regasification equity benchmarking by company
  • Regasification contract benchmarking by company
  • Buyer exposure by company

click to enlarge image

Example: BP and Shell LNG contract portfolios.

LNG Trade Flow Map
  • Visualize trade flows on a map
  • Customize a view to country or project level
  • Use filters to analyze view by spot

click to enlarge image

Example: LNG trade flows from Australia to end markets.

LNG Vessel Tracker
  • Use our Marketing Intelligence Network (MINT) to visualize and quantify LNG cargo movements in real time on a map and to see detailed vessel history
  • Reporting features with no restrictions: Inbound Vessels, recent destination changes, vessel port callings, vessel list report, vessels in zone, intelligence list report
  • Reporting features restricted to 3 months history: Port arrivals, port departures, terminal arrivals, terminal departures, country arrivals, country departures, regional flows, vessel Ship-To-Ship (STS) and bunkering operations, vessel utilization graphs, vessel list utilization, historical zone arrivals

click to enlarge image

click to enlarge image

API
  • The LNG Analytics API provides direct, flexible access to all data underlying the LNG Analytics dashboards on Connect in a structured format that can be readily integrated into your internal data stores or connected directly to 3rd party applications such as Microsoft Excel or Power BI.
  • With our API, you can automate your LNG workflows to save valuable time and effort. Control how you access, store, analyze, and visualize our data—either on its own or mashed up with your proprietary data—to generate new insights and outlooks.
Content categoryDescription
Waterborne TradeAll core cargo data, loaded vs delivered dates/volumes, participants, trade routes
LiquefactionAll core asset information, dates, capacity buildouts, ownership, economics and costs, lat/long coordinates
RegasificationAll core asset information, dates, capacity buildouts, ownership, capacity reservations, lat/long coordinates
ContractsAll core contract specifics, pricing details, buildouts based on S&P Global start dates
ShippingAll core vessel details for existing fleet and orderbook, historical charter rates
PricesMonthly reported gas and LNG price markers from LNG service, weekly landed spot price assessments; futures curves
ForecastsShort and long-term supply and demand, import/export capacity, prices
Supporting TablesAll project-country-regional classifications used in LNG Analytics
Follow Energy & Natural Resources Research and Analysis
View All
Blog Sep 07, 2024

Indonesia's block awards drive exploration across mature, emerging, and frontier areas

Blog Sep 06, 2024

Fueling growth: Indonesia's block awards drive exploration across mature, emerging, and frontier areas

Blog Sep 06, 2024

Not in my backyard… or yours: What the new EU Methane Rule means for Kazakh crude oil exports

Blog Sep 04, 2024

GHG intensity of offshore Nigeria production in 2023

Related Products

Global Gas

PointLogic Gas

LNG Data Lake

Global LNG Market Outlook 2021

US Exports of Liquefied Natural Gas (LNG)

Explore

  • Climate and Sustainability
  • Oil & Gas Upstream
  • Natural Gas / LNG Markets
{"items" : [ {"name":"facts","url":"","enabled":false,"desc":"","alt":"","mobdesc":"PDF","mobmsg":""},{"name":"login","url":"","enabled":false,"desc":"Product Login for existing customers","alt":"Login","large":true,"mobdesc":"Login","mobmsg":"Product Login for existing customers"},{"name":"sales","override":"","number":"[num]","enabled":true,"desc":"Call Sales [num]","proddesc":"[num]","alt":"Call Sales</br>[num]","mobdesc":"Sales","mobmsg":"Call Sales: [num]"}, {"name":"share","enabled":true,"desc":"<strong>Share</strong>","mobdesc":"Share","options":[ {"name":"facebook","url":"https://www.facebook.com/sharer.php?u=http%3a%2f%2fssl.ihsmarkit.com%2fcommodityinsights%2fen%2fci%2fproducts%2fglobal-lng-predictive-analytics.html","enabled":true},{"name":"twitter","url":"https://twitter.com/intent/tweet?url=http%3a%2f%2fssl.ihsmarkit.com%2fcommodityinsights%2fen%2fci%2fproducts%2fglobal-lng-predictive-analytics.html&text=Global+LNG+analytics+%26+market+outlook+%7c+S%26P+Global","enabled":true},{"name":"linkedin","url":"https://www.linkedin.com/sharing/share-offsite/?url=http%3a%2f%2fssl.ihsmarkit.com%2fcommodityinsights%2fen%2fci%2fproducts%2fglobal-lng-predictive-analytics.html","enabled":true},{"name":"email","url":"?subject=Global LNG analytics & market outlook | S&P Global&body=http%3a%2f%2fssl.ihsmarkit.com%2fcommodityinsights%2fen%2fci%2fproducts%2fglobal-lng-predictive-analytics.html","enabled":true},{"name":"whatsapp","url":"https://api.whatsapp.com/send?text=Global+LNG+analytics+%26+market+outlook+%7c+S%26P+Global http%3a%2f%2fssl.ihsmarkit.com%2fcommodityinsights%2fen%2fci%2fproducts%2fglobal-lng-predictive-analytics.html","enabled":true}]}, {"name":"rtt","enabled":true,"mobdesc":"Top"} ]}
Filter Sort